Custom Dam Tool
1. Dam area
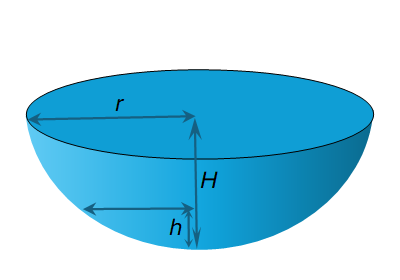
2. Dam profile
3. Climate estimates
4. Water balance forecasts
Instructions: Draw the dam boundary, then draw the surrounding catchment boundary to calculate the respective areas.
Dam boundary is the estimated boundary when 100% full.
b: Draw catchment boundary
Auto calculated variables
Dam area:
m2
Catchment area:
m2
Note:
Drawn dam boundaries must be approximately circular or square shapes, complex shapes are not supported by the water balance model.
Modelled shape types include Spherical Cap, Ring Tank, and Truncated Pyramid.
Modelled shape types include Spherical Cap, Ring Tank, and Truncated Pyramid.
The rating curve chart shows the volume of the dam in relation to vertical water level.
The water balance forecasts chart shows the predicted water level and volume for various climate scenarios from the starting water level.
The water balance forecasts chart shows the predicted water level and volume for various climate scenarios from the starting water level.
Chart options
Maximum depth when full:
m
Current (or actual) water depth:
m
Household demand:
people
Stock demand:
cattle
Stock demand:
sheep
Climate estimates
Auto calculated variables
Dam area:
m2
Catchment area:
m2
Maximum volume when full:
m3