South West (Corangamite) Dam 1 SW 1
Summary
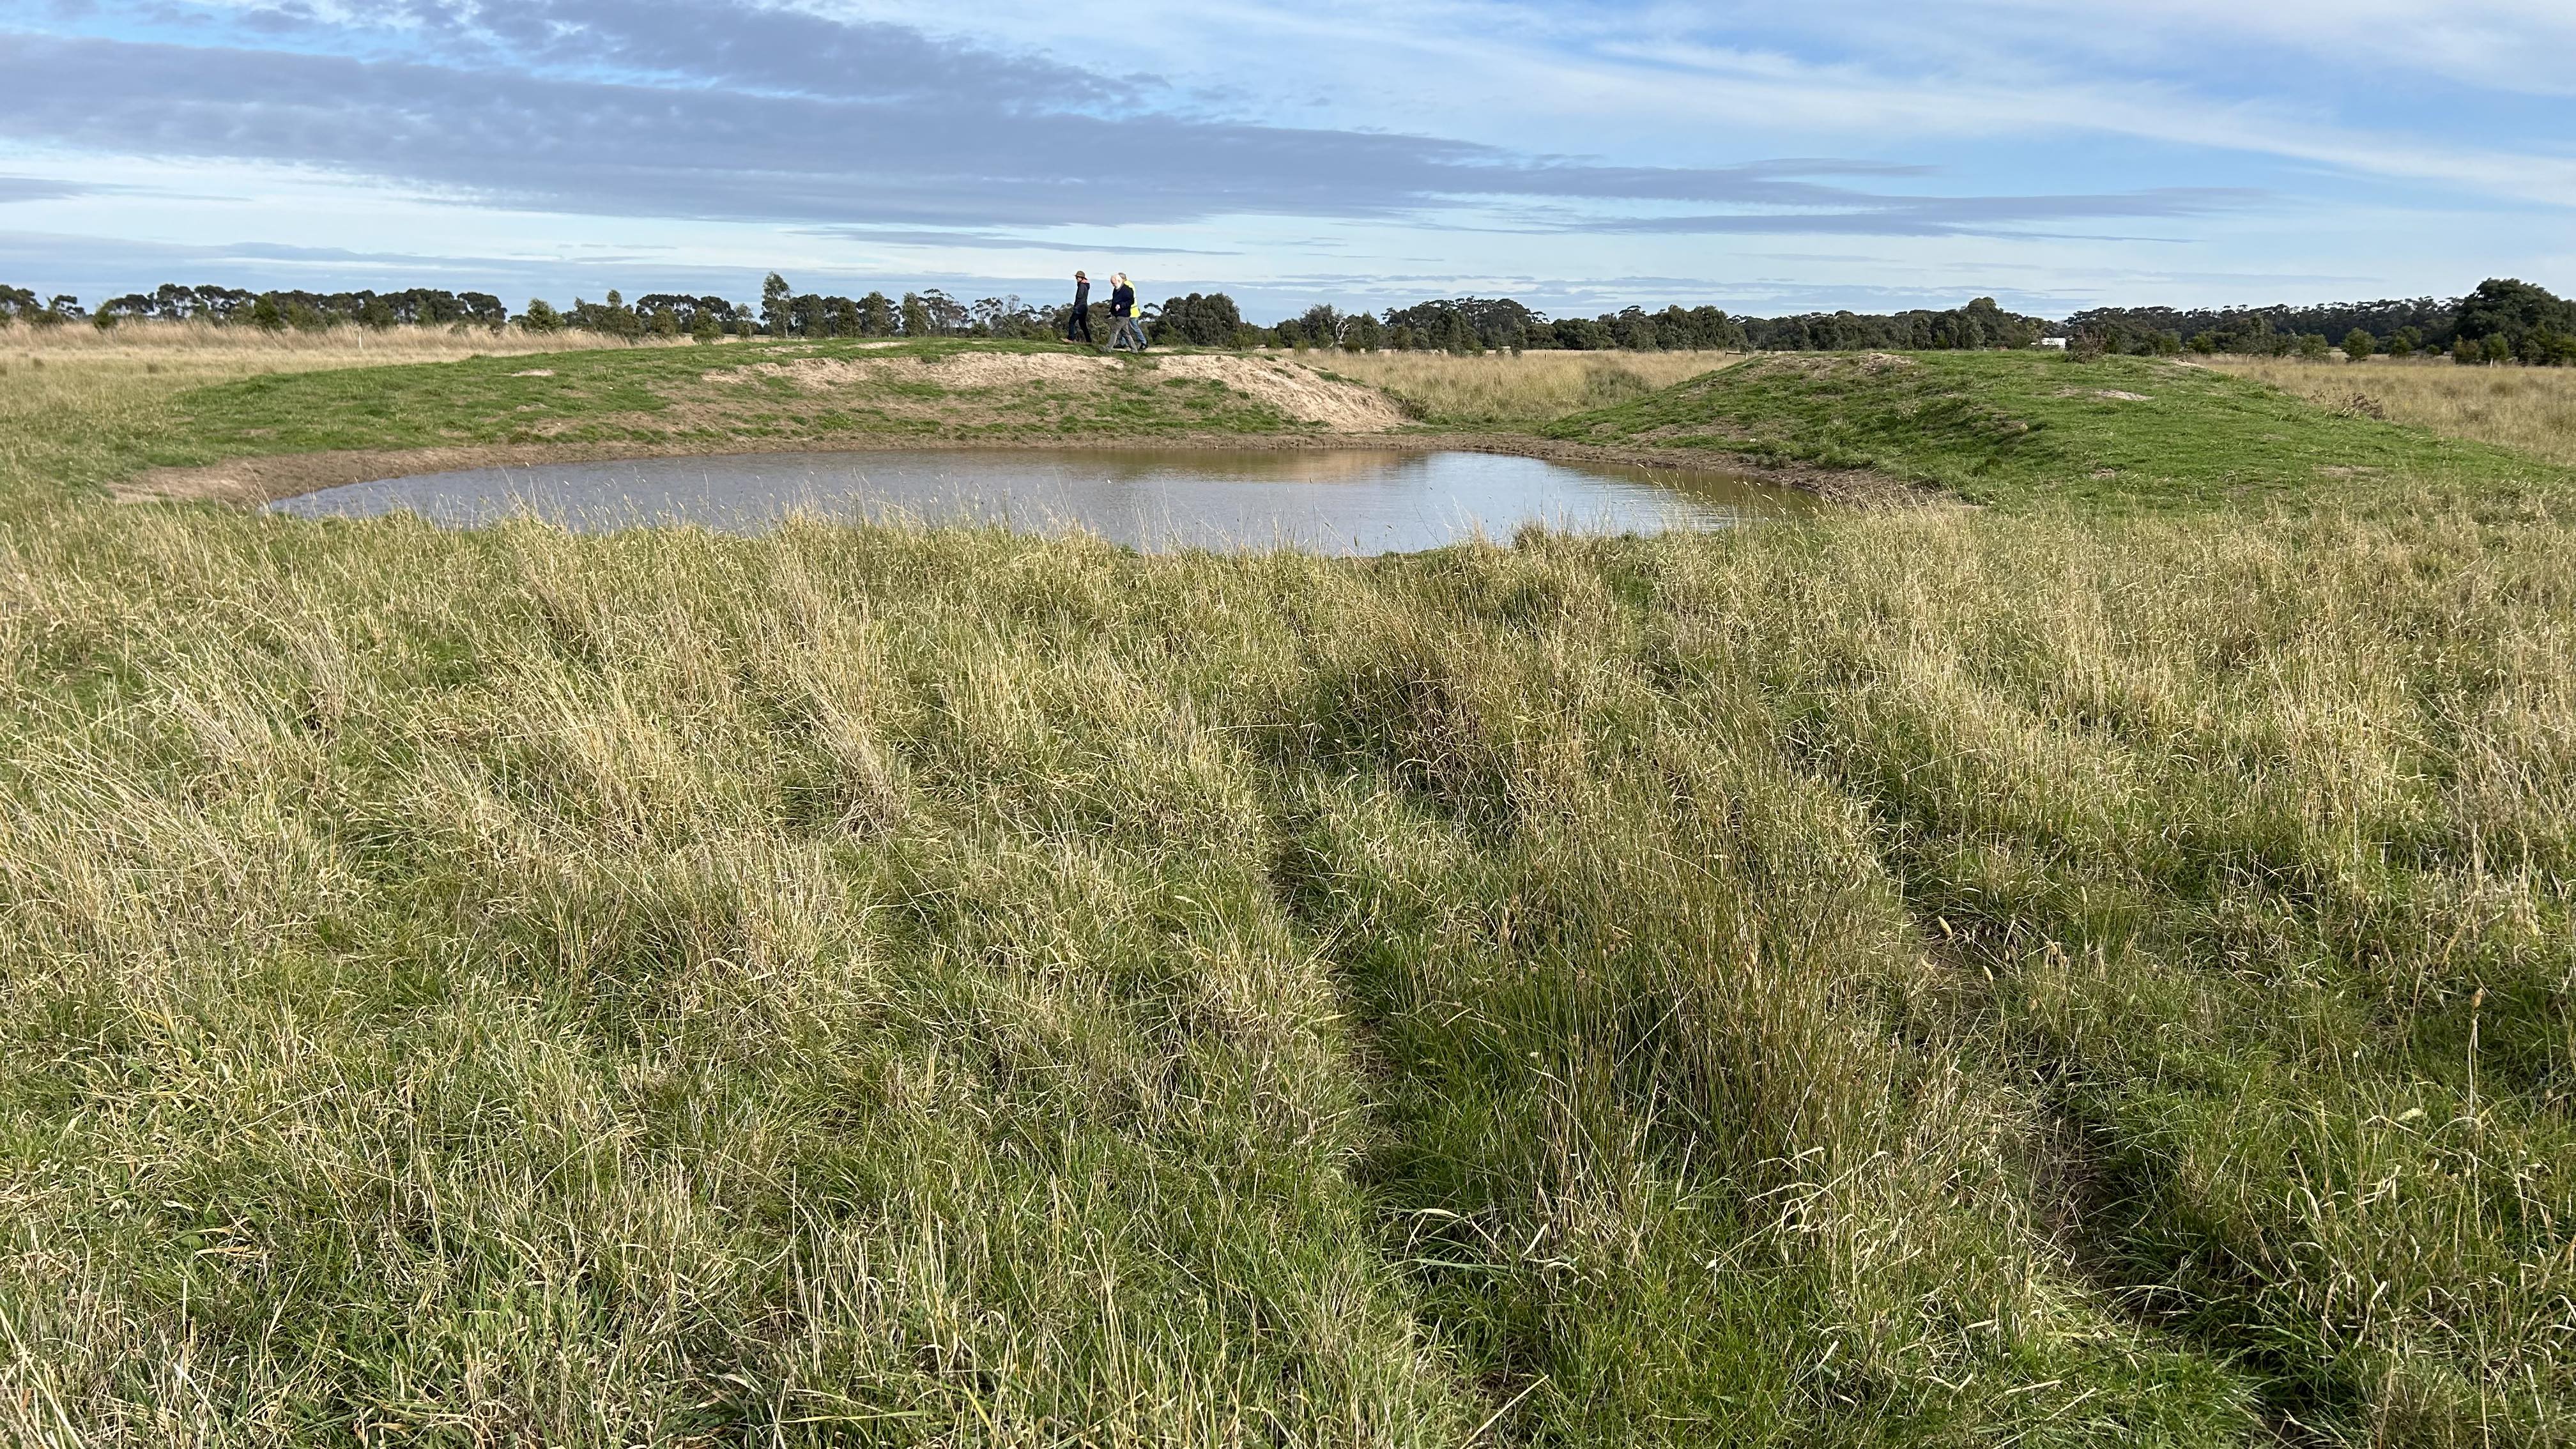
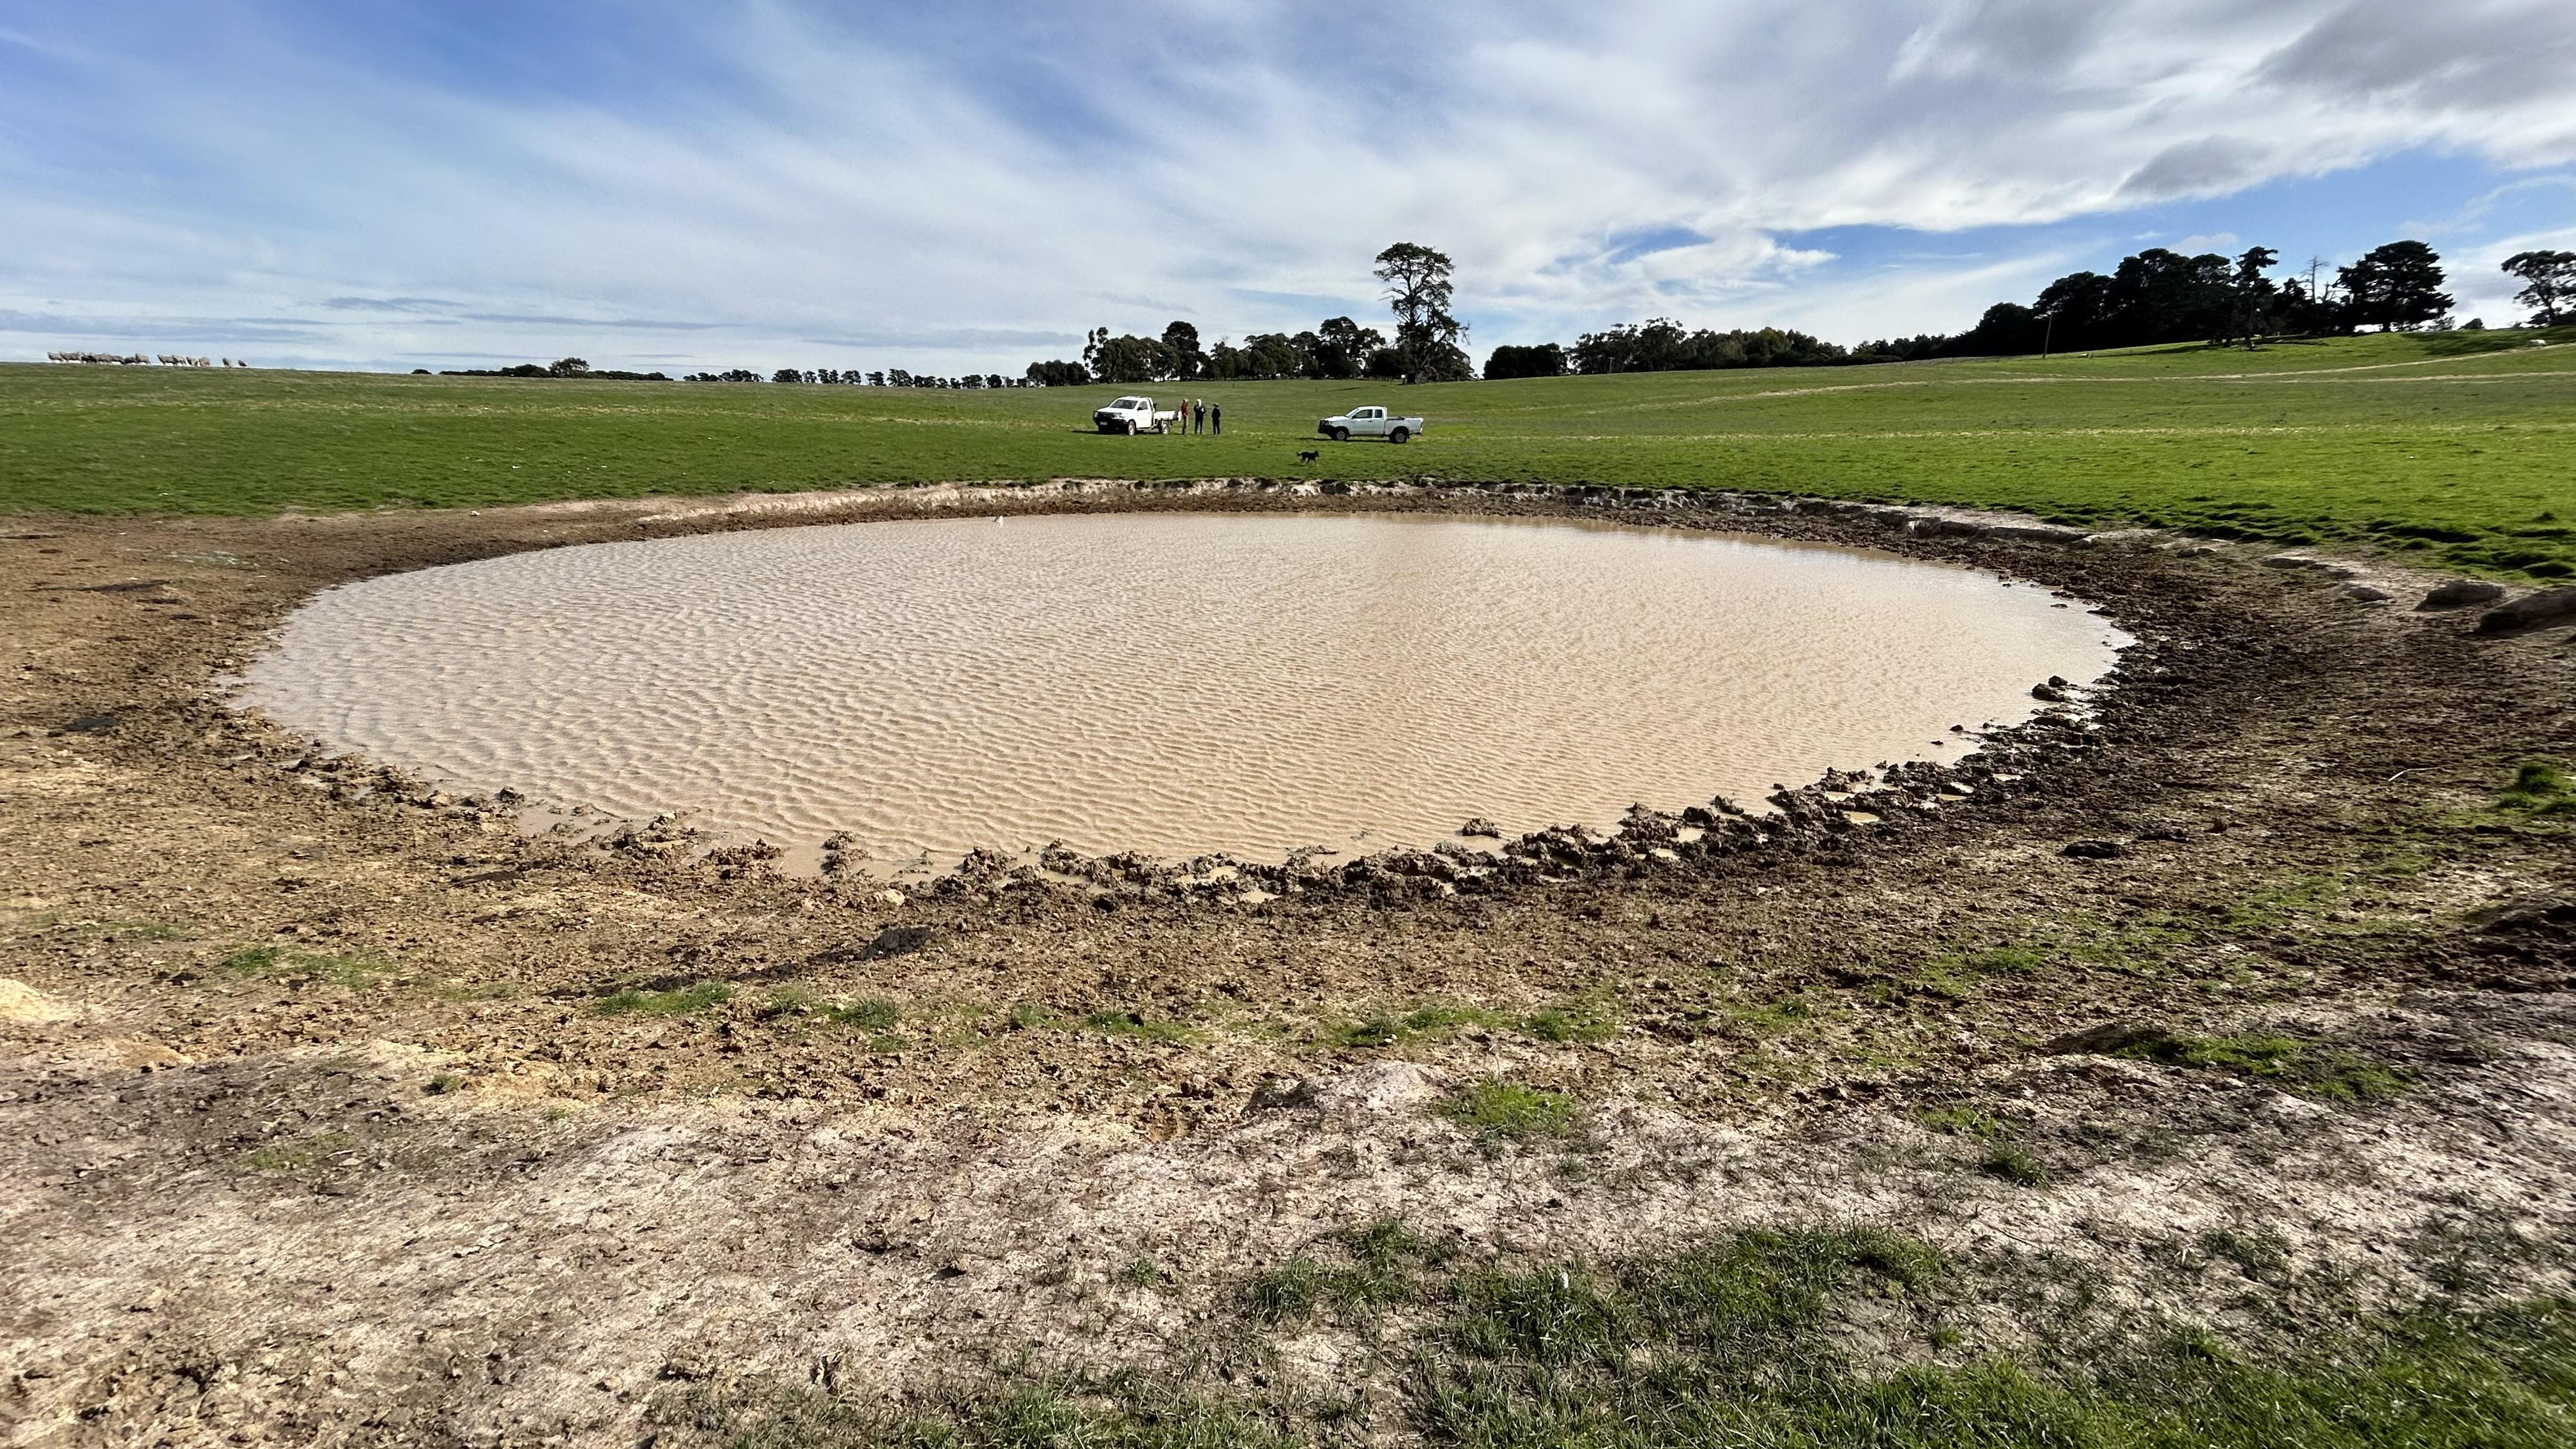
Location: Pittong, Golden Plains Shire, Corangamite CMA
Primary Land use: Mixed farming, grazing
Australian Drainage Division: Southeast Coast (Division II)
Australian River Basin: Lake Corangamite (Basin 34)
Catchment Geology:
Miocene to Holocene Newer Volcanic Group: basalt flows (Neo) to the north
and Late Devonian Tiac Granite (G307) to the south.
Dam is constructed at the boundary of the Tiac Granite and Mt Bute Granite (G308) plutons
Catchment Geomorphology:
2.0 Western Uplands (Tier 1);
2.1 Dissected Uplands (Tier 2);
2.1.4 Hills, valley slopes and plains on plutonic Palaeozoic rocks (Tier 3)
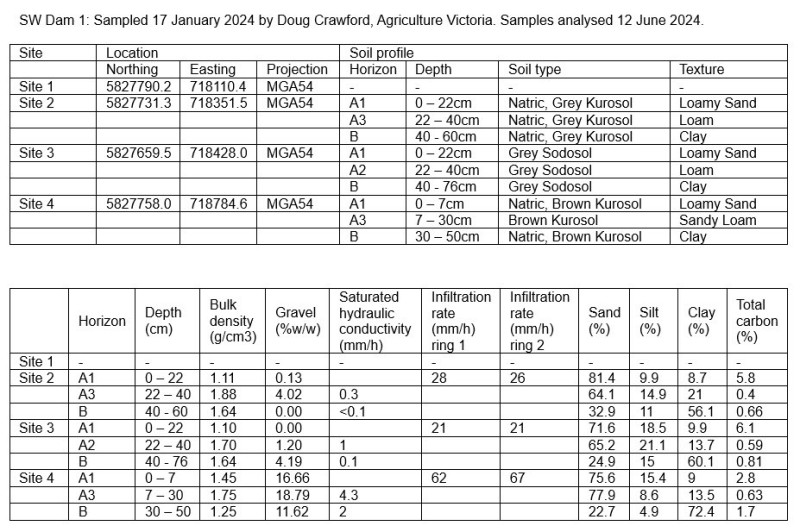
Australian Soil Classification: Sodosols
Catchment Soils:
About
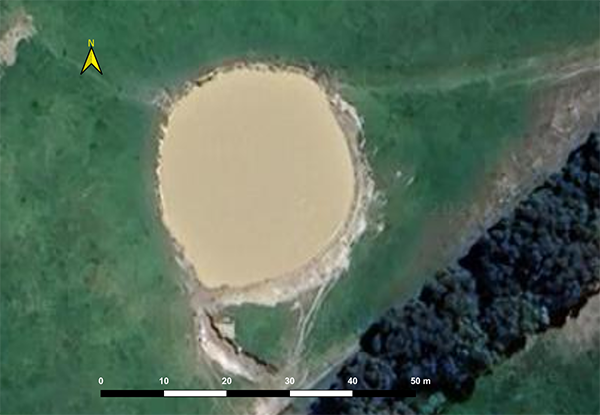
| Location | -37.67269,143.47675 |
|---|---|
| Shape Profile | Custom |
| Maximum depth when full | 2m |
| Current (or actual) water depth | 2m |
| Water level offset | 0.8m |
| Dam area | 896.29m2 |
| Maximum volume | 908.57m3 |
| Catchment area | 198000.00m2 |
Water balance
The water balance forecasts chart shows the predicted water level and volume for various climate scenarios from the starting water level.
Chart options
Maximum depth when full:Auto calculated variables
Dam area:20 year monthly climate range
| Month | Rainfall range | Evaporation range | |||||||
|---|---|---|---|---|---|---|---|---|---|
| Decile 1 | Decile 3 | Decile 5 | Decile 7 | Decile 10 | Decile 7 | Decile 5 | Decile 3 | ||
| Drought | Dry | Average | Wet | Drought | Dry | Average | Wet | ||
| January | 1.6mm | 17.6mm | 26.4mm | 50.6mm | 249.7mm | 210.3mm | 200.5mm | 182.4mm | |
| February | 1.6mm | 11.4mm | 20.7mm | 27.6mm | 184.1mm | 166.4mm | 159.7mm | 149.3mm | |
| March | 15.9mm | 21.9mm | 34.7mm | 37.7mm | 166.5mm | 145.2mm | 124.7mm | 110.9mm | |
| April | 13.6mm | 25.4mm | 37.7mm | 52mm | 91.8mm | 80.8mm | 70.7mm | 65.1mm | |
| May | 20.5mm | 37.9mm | 54.4mm | 59.7mm | 58mm | 47.6mm | 43.4mm | 38.2mm | |
| June | 21.2mm | 40.9mm | 53.7mm | 80.2mm | 34.5mm | 29.8mm | 26.7mm | 25.9mm | |
| July | 38.4mm | 45.7mm | 63mm | 72.9mm | 42.6mm | 35.4mm | 32.2mm | 30.7mm | |
| August | 23.1mm | 37.4mm | 54.9mm | 57.7mm | 62.2mm | 49.3mm | 45.9mm | 44.5mm | |
| September | 20.5mm | 37.7mm | 50.9mm | 61.2mm | 90.1mm | 78.8mm | 76.6mm | 71.2mm | |
| October | 4.5mm | 29mm | 43.4mm | 75.7mm | 157.6mm | 121mm | 108mm | 100.9mm | |
| November | 30.7mm | 44.4mm | 52.4mm | 61.2mm | 168.5mm | 151.1mm | 140.2mm | 124.9mm | |
| December | 6.2mm | 26.4mm | 36.9mm | 43.5mm | 236.9mm | 185.1mm | 175.9mm | 161.3mm | |
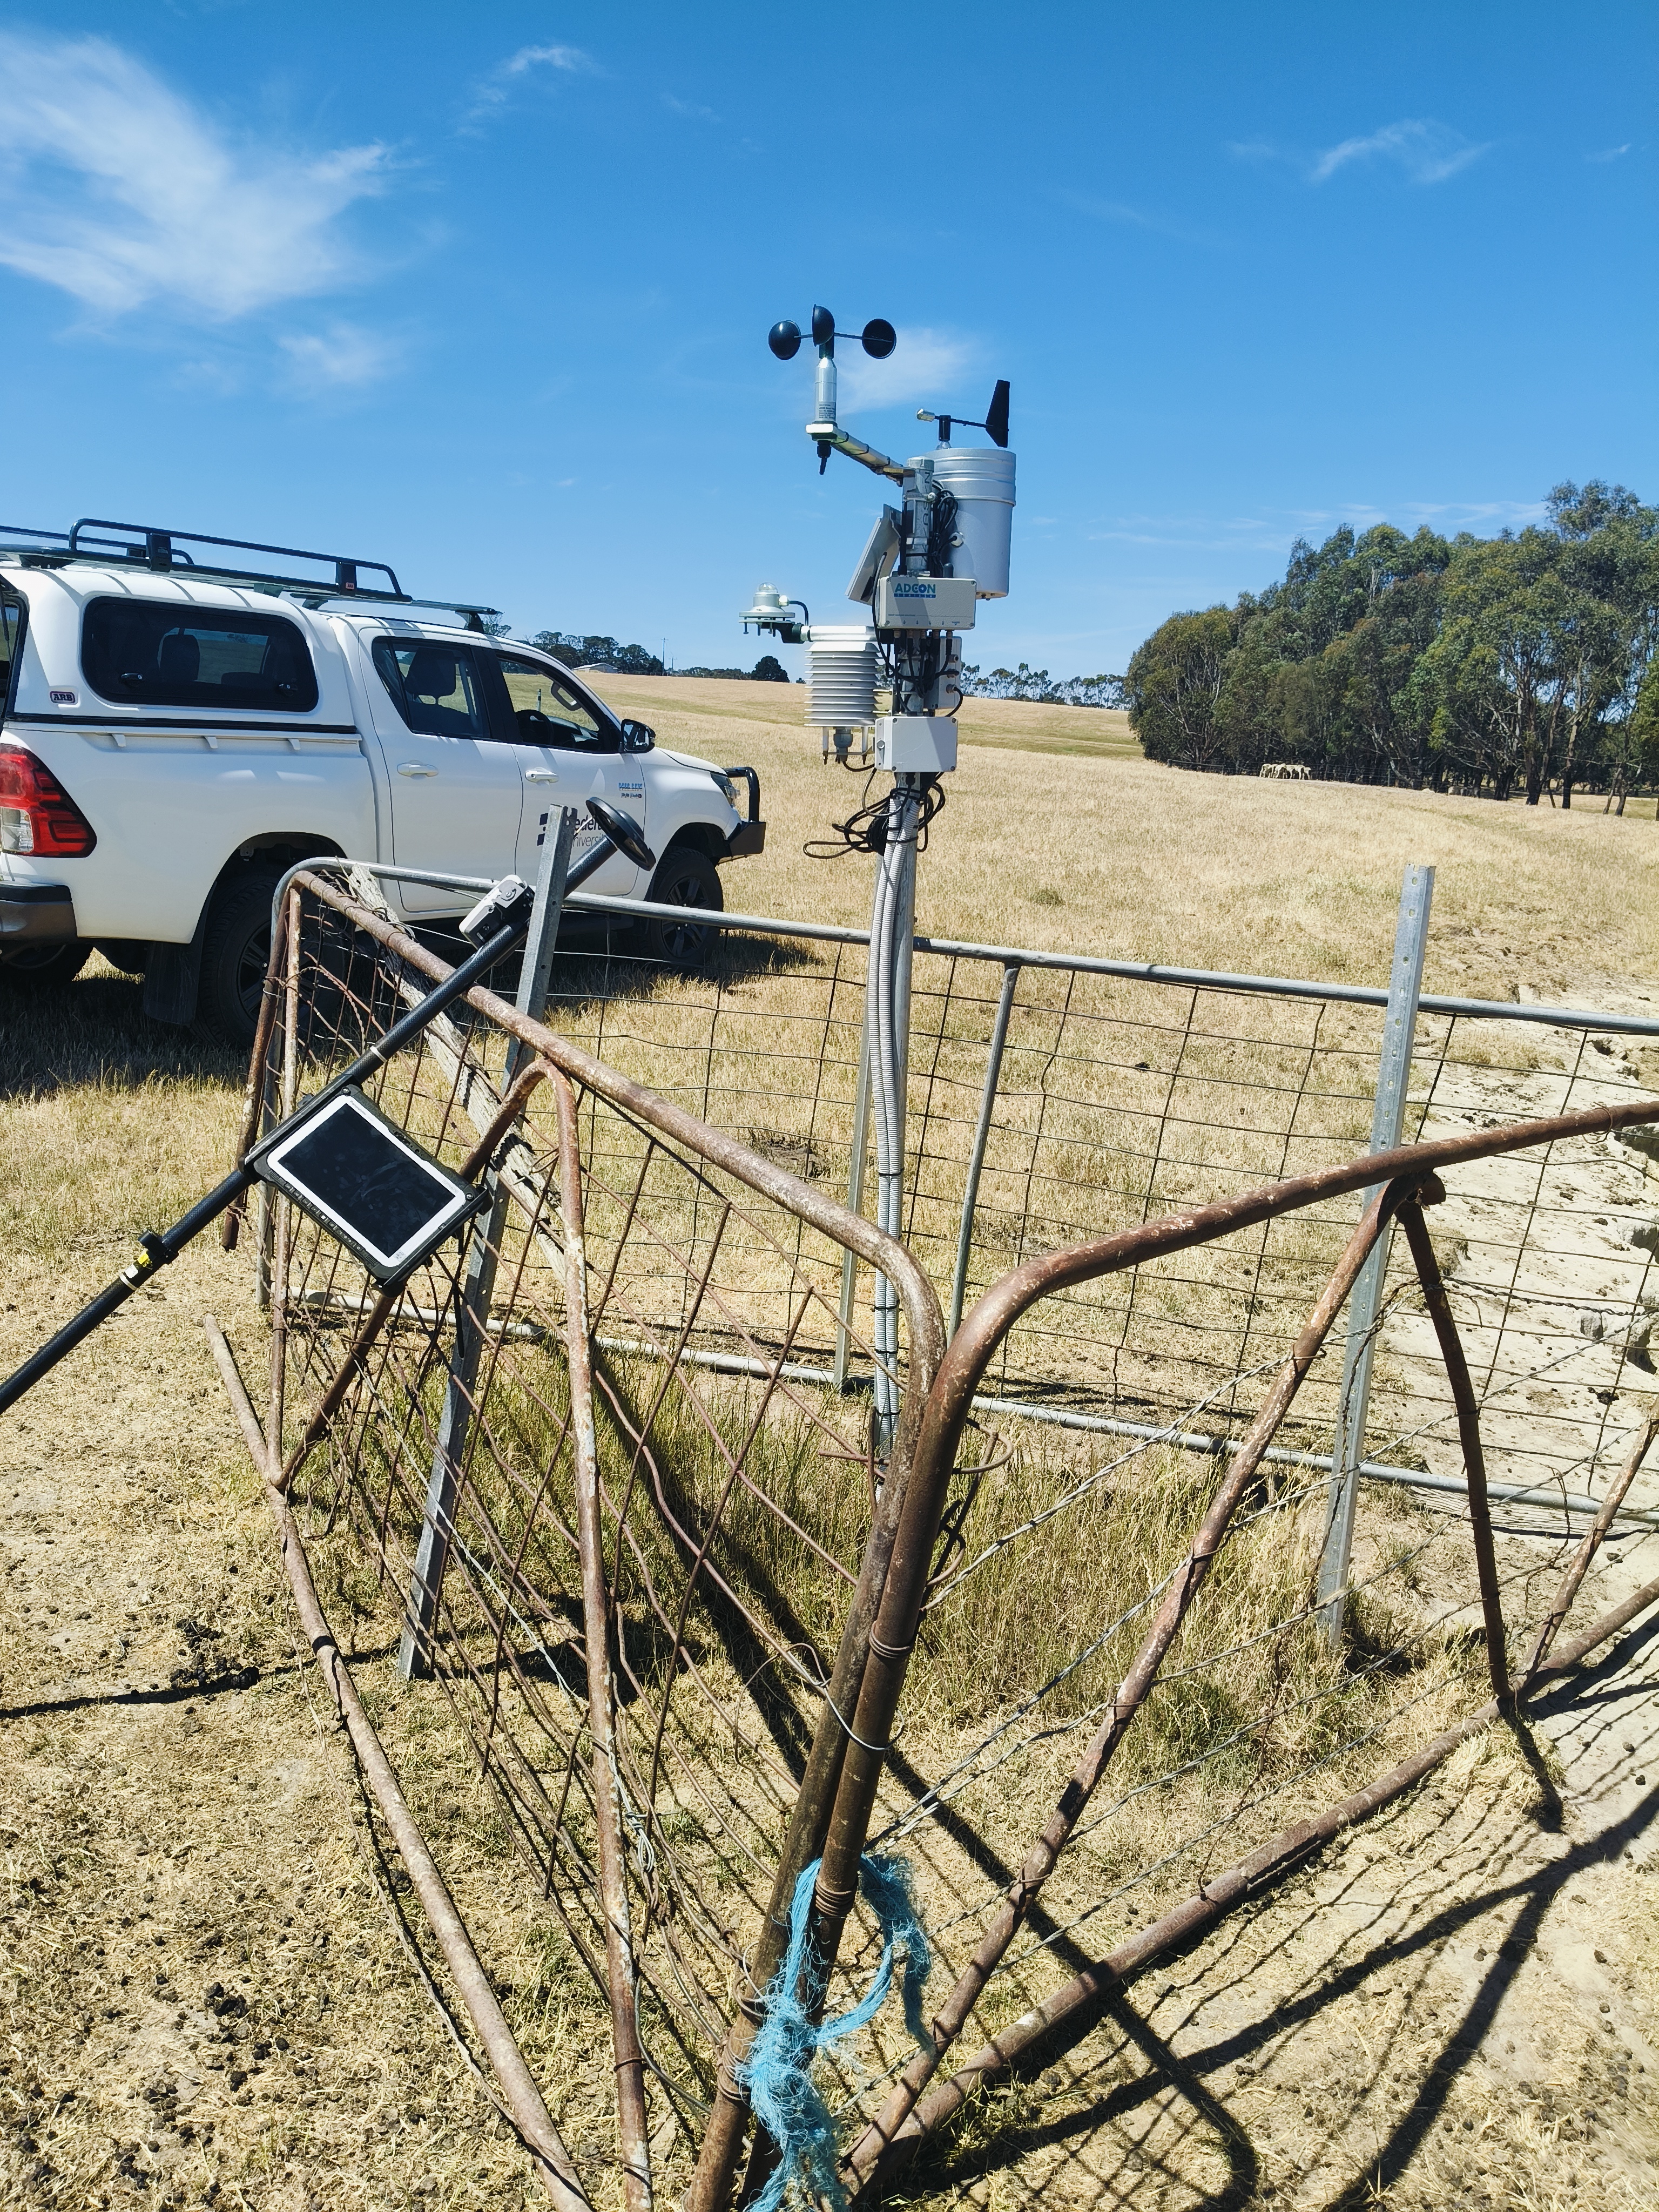
Monitoring
Spatial mapping
Layer stacking order (drag to reorder)
No active layer(s)
Address Search
 HERE
HERE
Measure
Measure distance between points or area of a polygon
Active Layer
Transparency
Toggle querying
Specify Filter Attributes
Export this layer
Current map extent (max 500 features)
Climate history
20 year monthly climate range
| Month | Rainfall range | Evaporation range | |||||||
|---|---|---|---|---|---|---|---|---|---|
| Decile 1 | Decile 3 | Decile 5 | Decile 7 | Decile 10 | Decile 7 | Decile 5 | Decile 3 | ||
| Drought | Dry | Average | Wet | Drought | Dry | Average | Wet | ||
| January | 1.6mm | 17.6mm | 26.4mm | 50.6mm | 249.7mm | 210.3mm | 200.5mm | 182.4mm | |
| February | 1.6mm | 11.4mm | 20.7mm | 27.6mm | 184.1mm | 166.4mm | 159.7mm | 149.3mm | |
| March | 15.9mm | 21.9mm | 34.7mm | 37.7mm | 166.5mm | 145.2mm | 124.7mm | 110.9mm | |
| April | 13.6mm | 25.4mm | 37.7mm | 52mm | 91.8mm | 80.8mm | 70.7mm | 65.1mm | |
| May | 20.5mm | 37.9mm | 54.4mm | 59.7mm | 58mm | 47.6mm | 43.4mm | 38.2mm | |
| June | 21.2mm | 40.9mm | 53.7mm | 80.2mm | 34.5mm | 29.8mm | 26.7mm | 25.9mm | |
| July | 38.4mm | 45.7mm | 63mm | 72.9mm | 42.6mm | 35.4mm | 32.2mm | 30.7mm | |
| August | 23.1mm | 37.4mm | 54.9mm | 57.7mm | 62.2mm | 49.3mm | 45.9mm | 44.5mm | |
| September | 20.5mm | 37.7mm | 50.9mm | 61.2mm | 90.1mm | 78.8mm | 76.6mm | 71.2mm | |
| October | 4.5mm | 29mm | 43.4mm | 75.7mm | 157.6mm | 121mm | 108mm | 100.9mm | |
| November | 30.7mm | 44.4mm | 52.4mm | 61.2mm | 168.5mm | 151.1mm | 140.2mm | 124.9mm | |
| December | 6.2mm | 26.4mm | 36.9mm | 43.5mm | 236.9mm | 185.1mm | 175.9mm | 161.3mm | |