North East (Wangaratta) Dam 2b NE 3
Summary
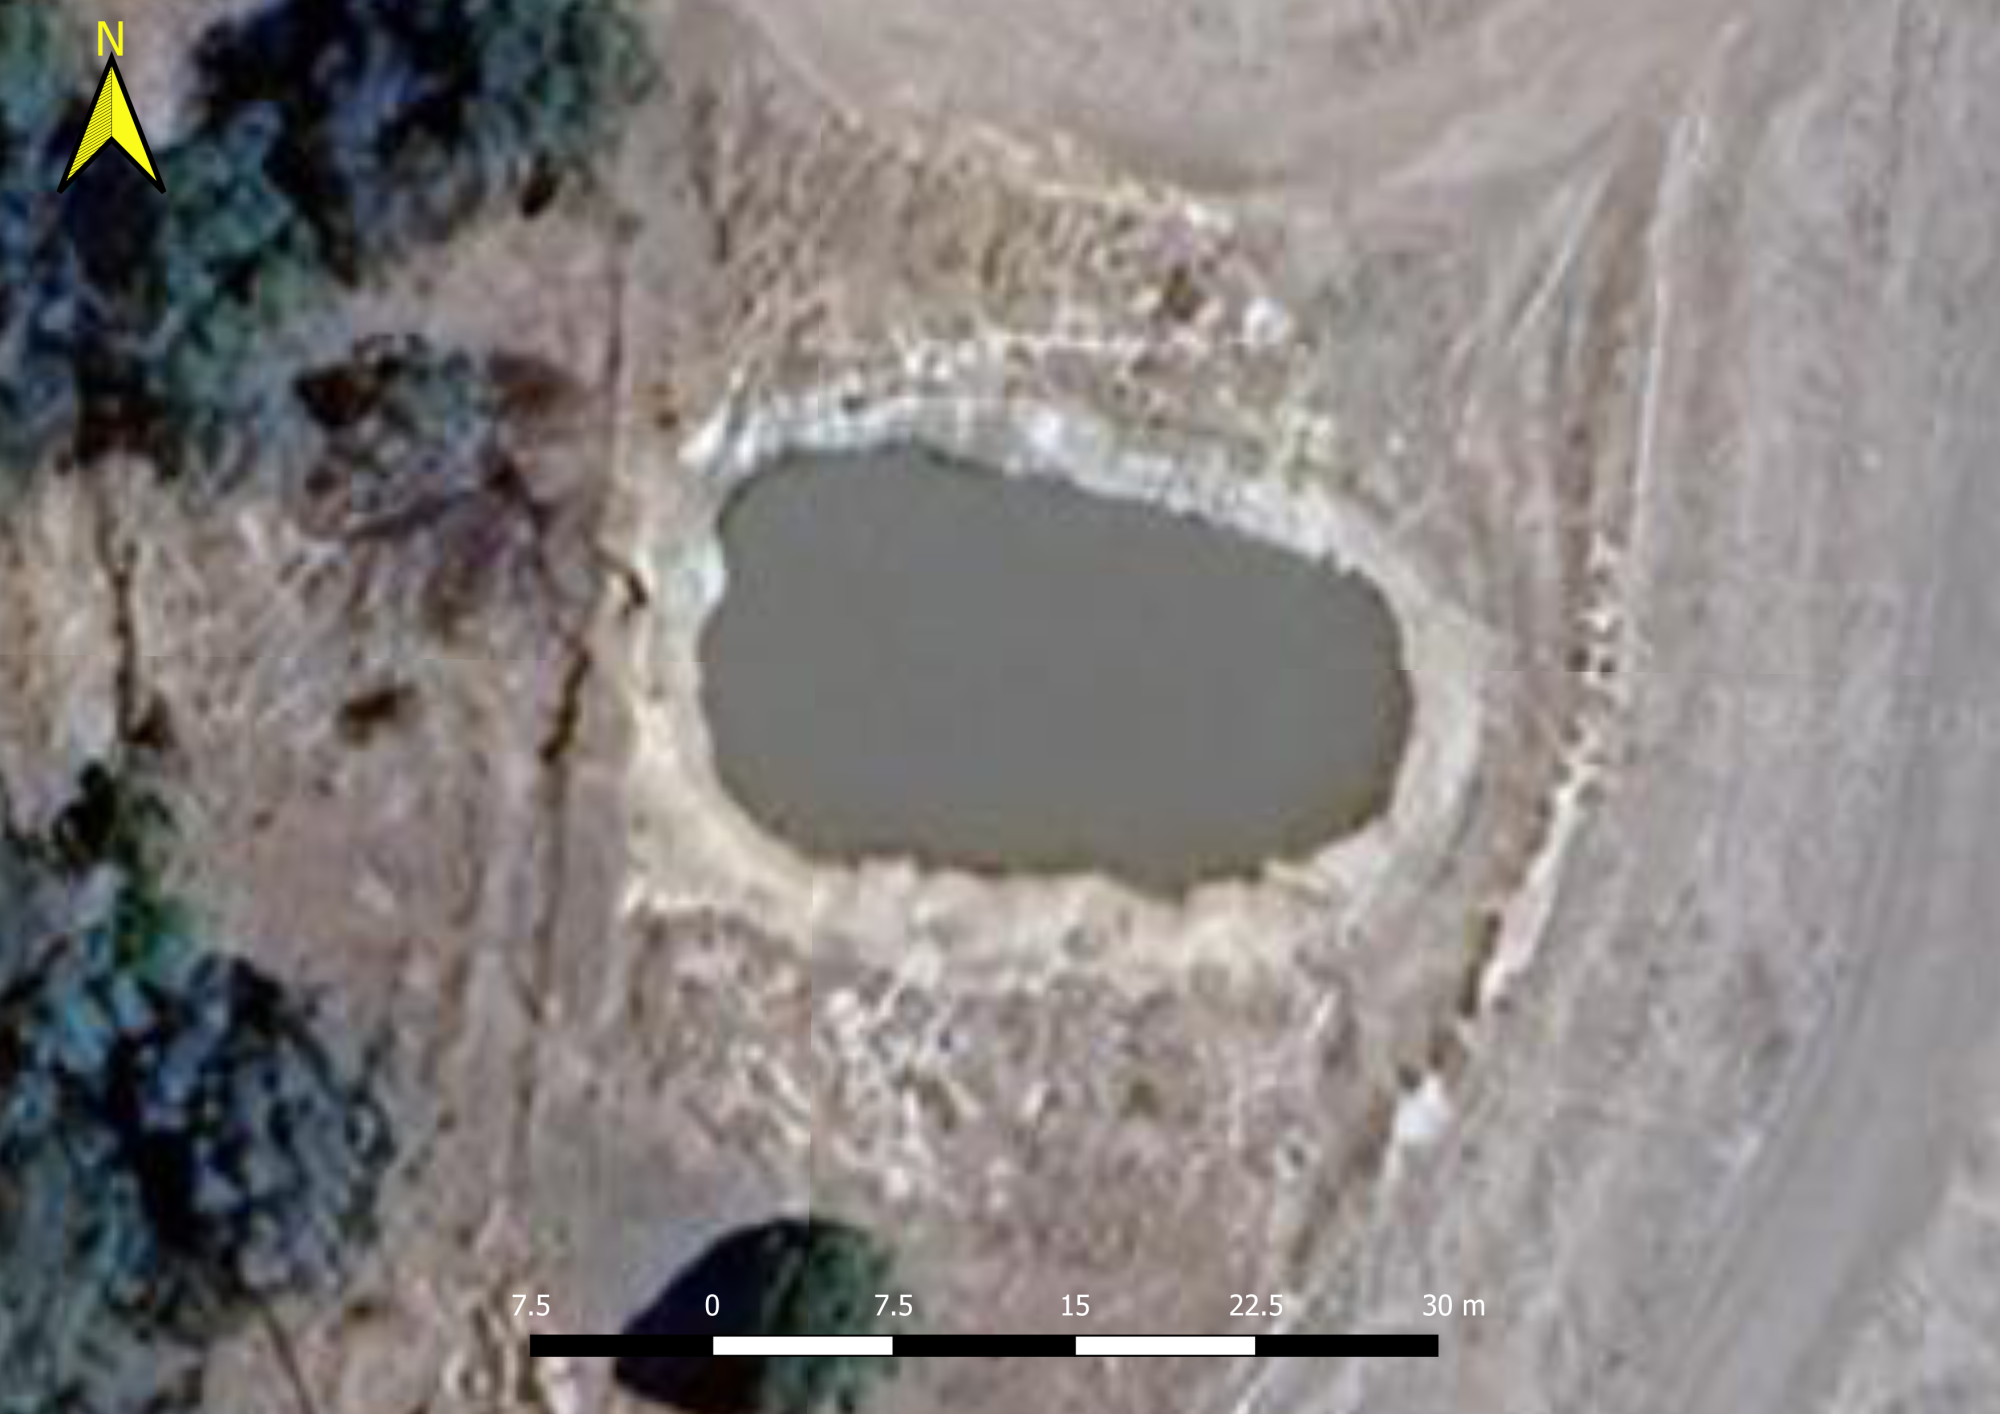
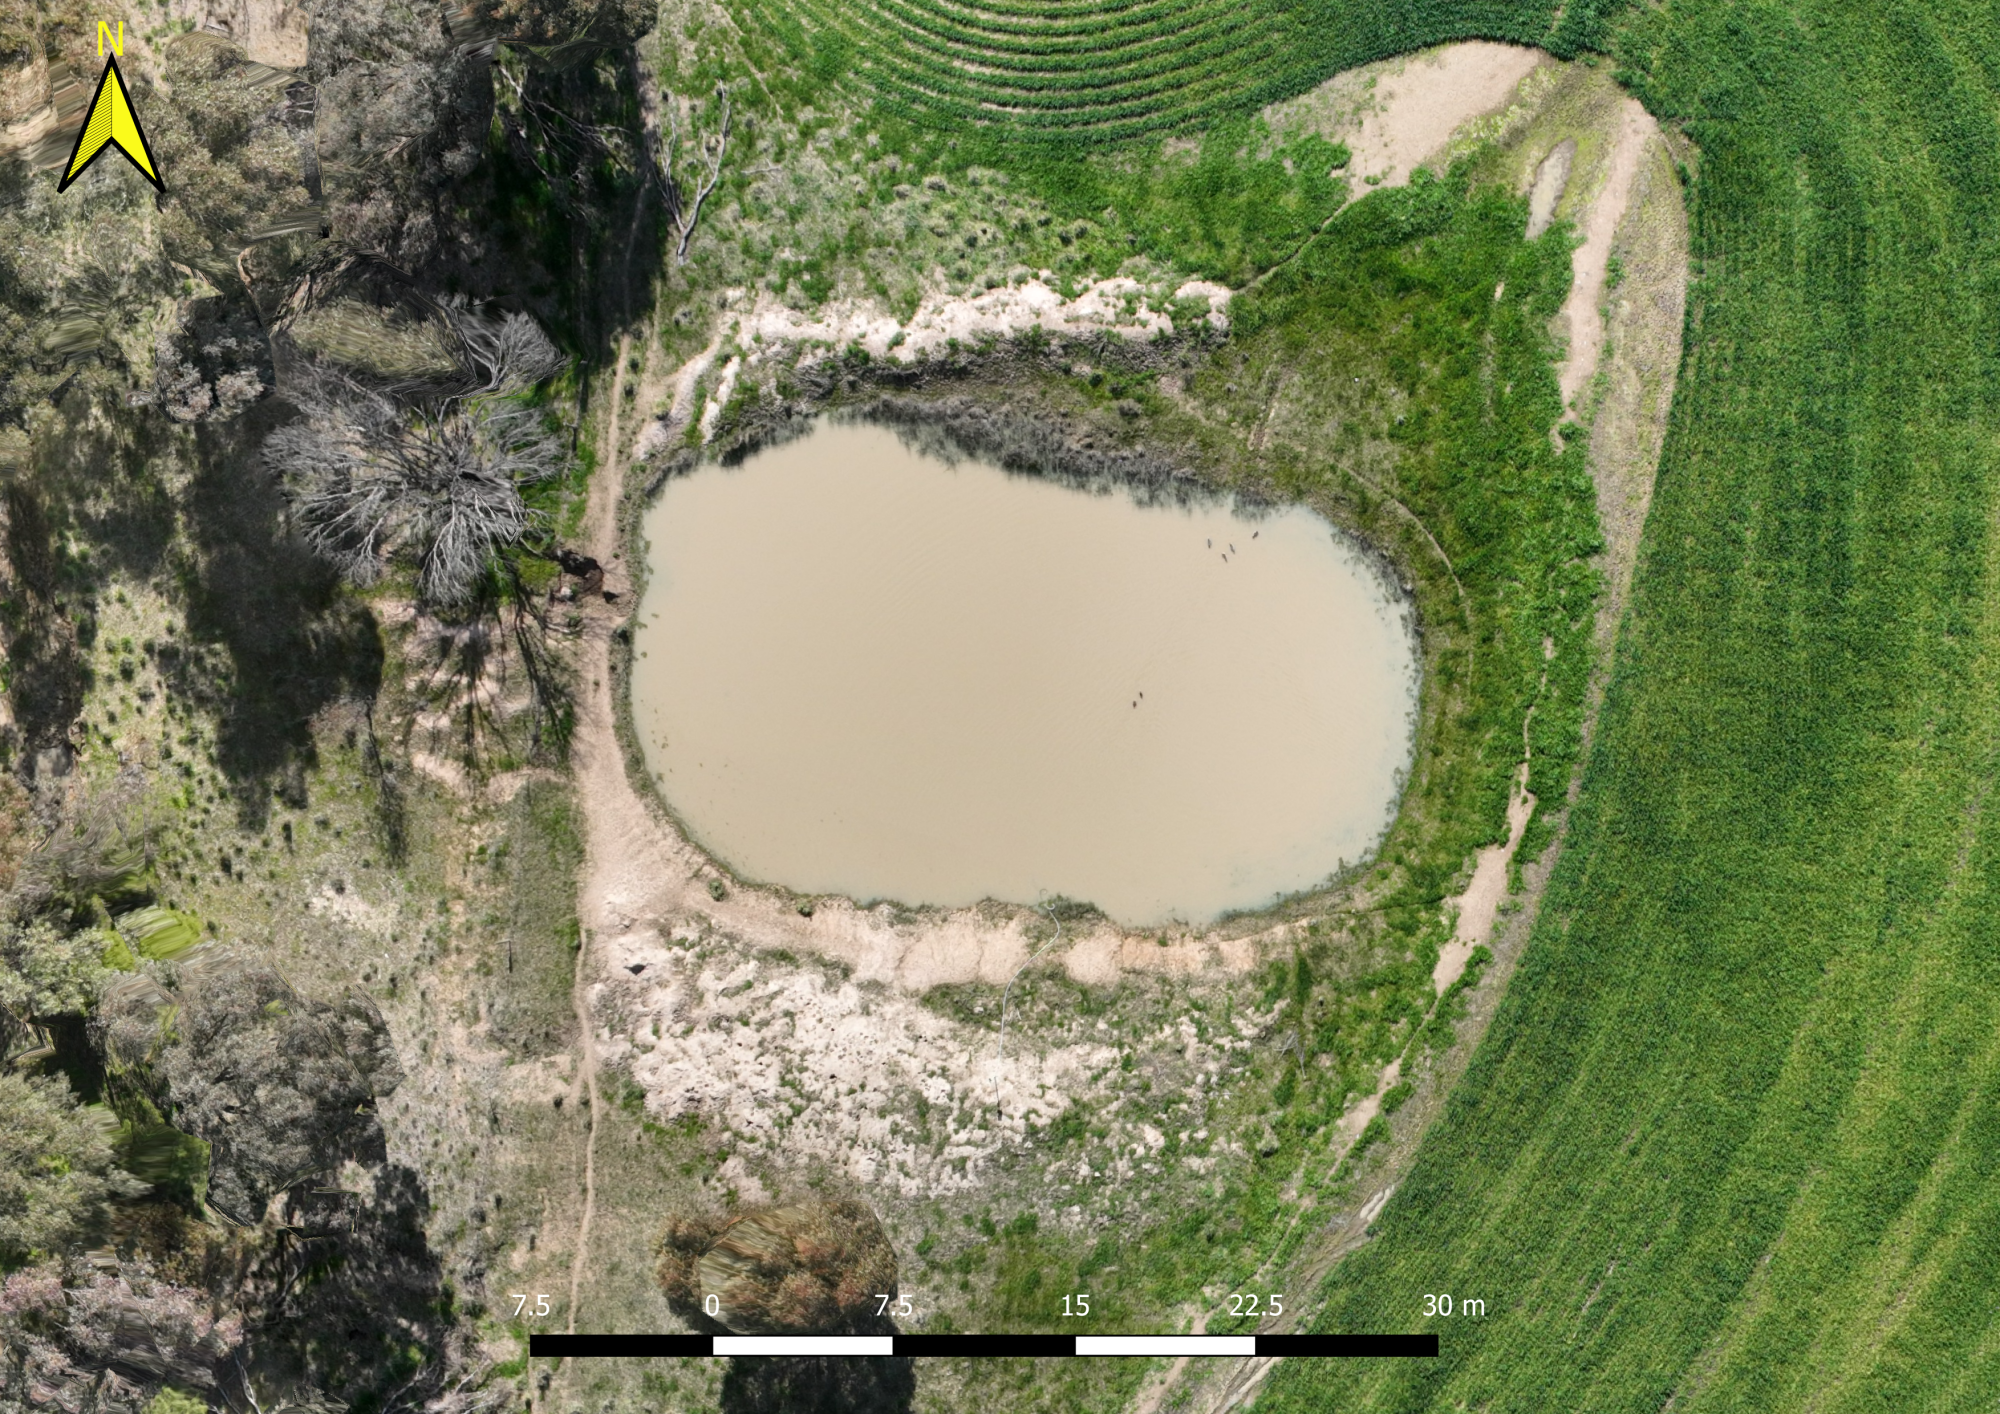
Location: Chesney Vale, Benalla Rural City, Goulburn Broken CMA
Primary Land use: Mixed farming; cropping and grazing
Australian Drainage Division: Murray-Darling (Division IV)
Australian River Basin: Broken River (Basin 4)
Catchment Geology: Pliocene to Pleistocene dissected granite-derived colluvium (Nc4) (sand)
Catchment Geomorphology:
4.0 Northern Riverine Plain (Tier 1);
4.3 Alluvial fans and aprons (Tier 2)
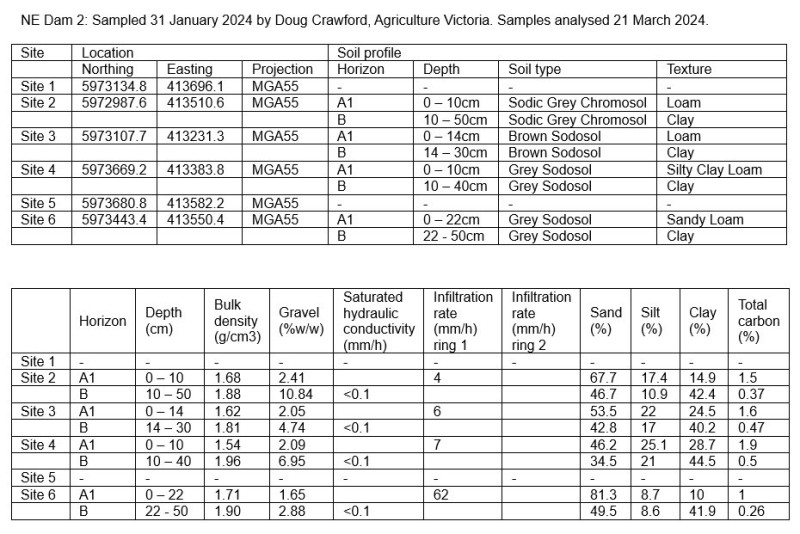
Australian Soil Classification: Sodosol
Catchment Soils:
About
| Location | -36.38315,146.03172 |
|---|---|
| Shape Profile | Custom |
| Maximum depth when full | 2m |
| Current (or actual) water depth | 3m |
| Water level offset | 0.2m |
| Dam area | 586.29m2 |
| Maximum volume | 545.86m3 |
| Catchment area | 14970.00m2 |
Water balance
The rating curve chart shows the volume of the dam in relation to vertical water level.
The water balance forecasts chart shows the predicted water level and volume for various climate scenarios from the starting water level.
The water balance forecasts chart shows the predicted water level and volume for various climate scenarios from the starting water level.
Chart options
Maximum depth when full:
m
Current (or actual) water depth:
m
Household demand:
people
Stock demand:
cattle
Stock demand:
sheep
Climate estimates
Auto calculated variables
Dam area:
m2
Catchment area:
m2
Maximum volume when full:
m3
20 year monthly climate range
| Month | Rainfall range | Evaporation range | |||||||
|---|---|---|---|---|---|---|---|---|---|
| Decile 1 | Decile 3 | Decile 5 | Decile 7 | Decile 10 | Decile 7 | Decile 5 | Decile 3 | ||
| Drought | Dry | Average | Wet | Drought | Dry | Average | Wet | ||
| January | 3.3mm | 18.4mm | 49.5mm | 59mm | 300.9mm | 249.3mm | 212.9mm | 201.8mm | |
| February | 3.7mm | 16.1mm | 25mm | 31.4mm | 228.1mm | 191.3mm | 176mm | 169mm | |
| March | 8.3mm | 21.6mm | 39.1mm | 52.4mm | 175.7mm | 159.1mm | 152.8mm | 128.1mm | |
| April | 5mm | 15.8mm | 25.6mm | 42mm | 102.1mm | 84.5mm | 77.7mm | 69.8mm | |
| May | 19.1mm | 27.4mm | 37.2mm | 43.7mm | 62.2mm | 46.5mm | 44.4mm | 41.3mm | |
| June | 23.6mm | 34.3mm | 46.7mm | 64.9mm | 36.6mm | 31.9mm | 29.6mm | 27.8mm | |
| July | 25.8mm | 39.2mm | 59.6mm | 67.4mm | 42mm | 35mm | 33.2mm | 31.2mm | |
| August | 3.3mm | 29.2mm | 44.6mm | 50.4mm | 57.2mm | 52.2mm | 48.6mm | 46.3mm | |
| September | 10.7mm | 13.7mm | 20.5mm | 49.1mm | 102.5mm | 85.7mm | 79.5mm | 77.7mm | |
| October | 9.2mm | 18.6mm | 30.7mm | 45.6mm | 157.9mm | 138.6mm | 124.5mm | 109.2mm | |
| November | 11.4mm | 31.1mm | 49.1mm | 71.2mm | 189mm | 171mm | 161.3mm | 156.4mm | |
| December | 10.5mm | 26.7mm | 36.5mm | 52.5mm | 243mm | 212.5mm | 205.1mm | 189.8mm | |
Monitoring
Spatial mapping
Click a location on the map to query all active layers
Layer stacking order (drag to reorder)
No active layer(s)
Address Search
Results by  HERE
HERE
HERE
Measure
Measure distance between points or area of a polygon
Attribution
Active Layer
Transparency
Toggle querying
Specify Filter Attributes
Export this layer
Current map extent (max 500 features)
Climate history
20 year monthly climate range
| Month | Rainfall range | Evaporation range | |||||||
|---|---|---|---|---|---|---|---|---|---|
| Decile 1 | Decile 3 | Decile 5 | Decile 7 | Decile 10 | Decile 7 | Decile 5 | Decile 3 | ||
| Drought | Dry | Average | Wet | Drought | Dry | Average | Wet | ||
| January | 3.3mm | 18.4mm | 49.5mm | 59mm | 300.9mm | 249.3mm | 212.9mm | 201.8mm | |
| February | 3.7mm | 16.1mm | 25mm | 31.4mm | 228.1mm | 191.3mm | 176mm | 169mm | |
| March | 8.3mm | 21.6mm | 39.1mm | 52.4mm | 175.7mm | 159.1mm | 152.8mm | 128.1mm | |
| April | 5mm | 15.8mm | 25.6mm | 42mm | 102.1mm | 84.5mm | 77.7mm | 69.8mm | |
| May | 19.1mm | 27.4mm | 37.2mm | 43.7mm | 62.2mm | 46.5mm | 44.4mm | 41.3mm | |
| June | 23.6mm | 34.3mm | 46.7mm | 64.9mm | 36.6mm | 31.9mm | 29.6mm | 27.8mm | |
| July | 25.8mm | 39.2mm | 59.6mm | 67.4mm | 42mm | 35mm | 33.2mm | 31.2mm | |
| August | 3.3mm | 29.2mm | 44.6mm | 50.4mm | 57.2mm | 52.2mm | 48.6mm | 46.3mm | |
| September | 10.7mm | 13.7mm | 20.5mm | 49.1mm | 102.5mm | 85.7mm | 79.5mm | 77.7mm | |
| October | 9.2mm | 18.6mm | 30.7mm | 45.6mm | 157.9mm | 138.6mm | 124.5mm | 109.2mm | |
| November | 11.4mm | 31.1mm | 49.1mm | 71.2mm | 189mm | 171mm | 161.3mm | 156.4mm | |
| December | 10.5mm | 26.7mm | 36.5mm | 52.5mm | 243mm | 212.5mm | 205.1mm | 189.8mm | |