North West (Bendigo) Dam 1 NW 1
Summary
Location: Shelbourne, City of Greater Bendigo, North Central CMA
Primary Land use: Mixed farming, grazing (western side); conservation area (eastern side)
Australian Drainage Division: Murray-Darling (Division IV)
Australian River Basin: Loddon River (Basin 7)
Catchment Geology: Ordovician Castlemaine Group (Ocl) sedimentary rocks (shale, sandstone, mudstone)
Catchment Geomorphology:
2.0 Western Uplands (Tier 1);
2.1 Dissected Uplands (Tier 2);
2.1.2 Hills, valley slopes and plains on non- granitic Palaeozoic rocks (Tier 3)
Australian Soil Classification: Sodosol
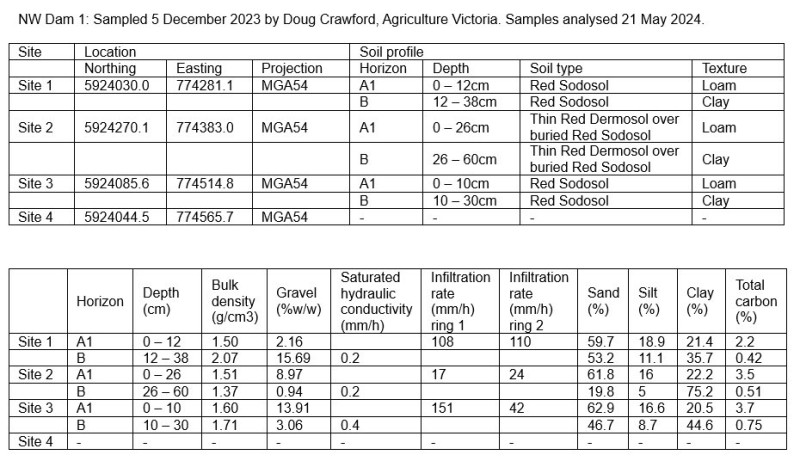
Catchment Soils:
About
| Location | -36.78893,144.07237 |
|---|---|
| Shape Profile | Custom |
| Maximum depth when full | 3m |
| Current (or actual) water depth | 2m |
| Water level offset | 0.2m |
| Dam area | 2165m2 |
| Maximum volume | 1701m3 |
| Catchment area | 229790.00m2 |
Water balance
The water balance forecasts chart shows the predicted water level and volume for various climate scenarios from the starting water level.
Chart options
Maximum depth when full:Auto calculated variables
Dam area:20 year monthly climate range
| Month | Rainfall range | Evaporation range | |||||||
|---|---|---|---|---|---|---|---|---|---|
| Decile 1 | Decile 3 | Decile 5 | Decile 7 | Decile 10 | Decile 7 | Decile 5 | Decile 3 | ||
| Drought | Dry | Average | Wet | Drought | Dry | Average | Wet | ||
| January | 0mm | 9.9mm | 21.4mm | 35.1mm | 298.3mm | 251.8mm | 220.7mm | 208.8mm | |
| February | 0.9mm | 5.7mm | 12.3mm | 22.2mm | 223.3mm | 195.9mm | 184.1mm | 169.4mm | |
| March | 9.9mm | 18.6mm | 30.9mm | 39.9mm | 179mm | 161.5mm | 143.6mm | 126.5mm | |
| April | 6.3mm | 10.9mm | 22.8mm | 48.7mm | 102.2mm | 92.4mm | 80mm | 72mm | |
| May | 18.1mm | 24.1mm | 31mm | 41.5mm | 62.9mm | 52.1mm | 46mm | 43.6mm | |
| June | 15mm | 27.2mm | 45.9mm | 59mm | 38.5mm | 32.2mm | 30.2mm | 28.1mm | |
| July | 19.1mm | 37.6mm | 47.6mm | 51.8mm | 46.6mm | 37.1mm | 34.9mm | 31.7mm | |
| August | 8.2mm | 29mm | 42.6mm | 45.2mm | 64.1mm | 53.9mm | 50.7mm | 48.4mm | |
| September | 8.3mm | 18mm | 27.9mm | 43.5mm | 97.8mm | 87.3mm | 83.4mm | 81.5mm | |
| October | 1.7mm | 13.6mm | 26.9mm | 30.2mm | 171.5mm | 137.6mm | 125mm | 110.5mm | |
| November | 6.2mm | 32.2mm | 35mm | 53.8mm | 198mm | 172.1mm | 161.4mm | 153.1mm | |
| December | 4.5mm | 19.1mm | 21.4mm | 37.4mm | 272.9mm | 218.7mm | 202.6mm | 195mm | |
Monitoring
Spatial mapping
Layer stacking order (drag to reorder)
No active layer(s)
Address Search
 HERE
HERE
Measure
Measure distance between points or area of a polygon
Active Layer
Transparency
Toggle querying
Specify Filter Attributes
Export this layer
Current map extent (max 500 features)
Climate history
20 year monthly climate range
| Month | Rainfall range | Evaporation range | |||||||
|---|---|---|---|---|---|---|---|---|---|
| Decile 1 | Decile 3 | Decile 5 | Decile 7 | Decile 10 | Decile 7 | Decile 5 | Decile 3 | ||
| Drought | Dry | Average | Wet | Drought | Dry | Average | Wet | ||
| January | 0mm | 9.9mm | 21.4mm | 35.1mm | 298.3mm | 251.8mm | 220.7mm | 208.8mm | |
| February | 0.9mm | 5.7mm | 12.3mm | 22.2mm | 223.3mm | 195.9mm | 184.1mm | 169.4mm | |
| March | 9.9mm | 18.6mm | 30.9mm | 39.9mm | 179mm | 161.5mm | 143.6mm | 126.5mm | |
| April | 6.3mm | 10.9mm | 22.8mm | 48.7mm | 102.2mm | 92.4mm | 80mm | 72mm | |
| May | 18.1mm | 24.1mm | 31mm | 41.5mm | 62.9mm | 52.1mm | 46mm | 43.6mm | |
| June | 15mm | 27.2mm | 45.9mm | 59mm | 38.5mm | 32.2mm | 30.2mm | 28.1mm | |
| July | 19.1mm | 37.6mm | 47.6mm | 51.8mm | 46.6mm | 37.1mm | 34.9mm | 31.7mm | |
| August | 8.2mm | 29mm | 42.6mm | 45.2mm | 64.1mm | 53.9mm | 50.7mm | 48.4mm | |
| September | 8.3mm | 18mm | 27.9mm | 43.5mm | 97.8mm | 87.3mm | 83.4mm | 81.5mm | |
| October | 1.7mm | 13.6mm | 26.9mm | 30.2mm | 171.5mm | 137.6mm | 125mm | 110.5mm | |
| November | 6.2mm | 32.2mm | 35mm | 53.8mm | 198mm | 172.1mm | 161.4mm | 153.1mm | |
| December | 4.5mm | 19.1mm | 21.4mm | 37.4mm | 272.9mm | 218.7mm | 202.6mm | 195mm | |
