North East (Wangaratta) Dam 1 NE 1
Summary
Location: Boweya, Rural City of Wangaratta, Goulburn Broken CMA
Primary Land use: Mixed farming, cropping
Australian Drainage Division: Murray-Darling (Division IV)
Australian River Basin: Broken River (Basin 4)
Catchment Geology: Pliocene to Holocene incised colluvium (Nc1) (silt, gravel, sand)
Catchment Geomorphology:
1.0 Eastern Uplands (Tier 1);
1.4 Dissected landscapes at a range of elevations (Tier 2);
1.4.6 Outlying ridges and hills (Tier 3)
Australian Soil Classification: Sodosol (at dam), Kurosol (main catchment), Rudosol (southern edge of catchment)
Catchment Soils:
About
| Location | -36.25926,146.13731 |
|---|---|
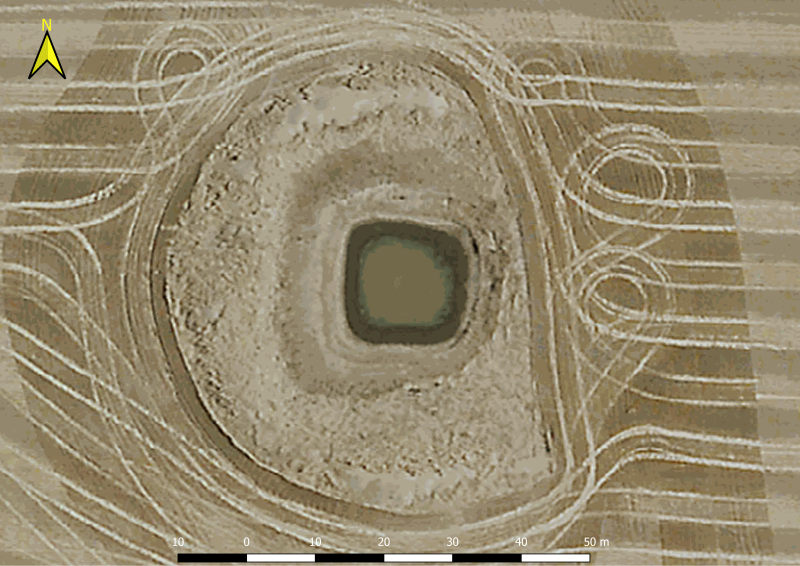
| Shape Profile | Custom |
| Maximum depth when full | 3m |
| Current (or actual) water depth | 3m |
| Water level offset | 0.2m |
| Dam area | 1666m2 |
| Maximum volume | 1595m3 |
| Catchment area | 41940.00m2 |
Water balance
The water balance forecasts chart shows the predicted water level and volume for various climate scenarios from the starting water level.
Chart options
Maximum depth when full:Auto calculated variables
Dam area:20 year monthly climate range
| Month | Rainfall range | Evaporation range | |||||||
|---|---|---|---|---|---|---|---|---|---|
| Decile 1 | Decile 3 | Decile 5 | Decile 7 | Decile 10 | Decile 7 | Decile 5 | Decile 3 | ||
| Drought | Dry | Average | Wet | Drought | Dry | Average | Wet | ||
| January | 3mm | 13.2mm | 40.8mm | 59.2mm | 306.8mm | 254.3mm | 214.6mm | 201.9mm | |
| February | 2.1mm | 14.1mm | 22.6mm | 33.2mm | 234.8mm | 193.4mm | 178.8mm | 170.7mm | |
| March | 6.5mm | 24.1mm | 34.5mm | 56.8mm | 178.3mm | 161.8mm | 156.4mm | 128.4mm | |
| April | 4.6mm | 15.3mm | 24.8mm | 37.3mm | 101.6mm | 84.9mm | 77.3mm | 69.6mm | |
| May | 22mm | 30.8mm | 34mm | 43.5mm | 61.7mm | 46.5mm | 44.3mm | 40.6mm | |
| June | 22.1mm | 31.9mm | 50mm | 64.4mm | 35.8mm | 31.1mm | 29.3mm | 26.9mm | |
| July | 23.5mm | 41.6mm | 58.3mm | 62.1mm | 40.8mm | 34mm | 33mm | 30.5mm | |
| August | 2.9mm | 28.9mm | 38.5mm | 52.1mm | 56.6mm | 51.1mm | 48.1mm | 45.8mm | |
| September | 6.8mm | 16.8mm | 22.8mm | 44mm | 101.9mm | 85.9mm | 80.1mm | 77.3mm | |
| October | 9.3mm | 23.9mm | 28.4mm | 46.4mm | 159.2mm | 140.4mm | 125.1mm | 108.2mm | |
| November | 8.7mm | 36.4mm | 51.7mm | 69.9mm | 192.6mm | 171.7mm | 163.1mm | 157.6mm | |
| December | 10.9mm | 24.6mm | 33.9mm | 49.5mm | 248.9mm | 215.5mm | 209.1mm | 191.9mm | |
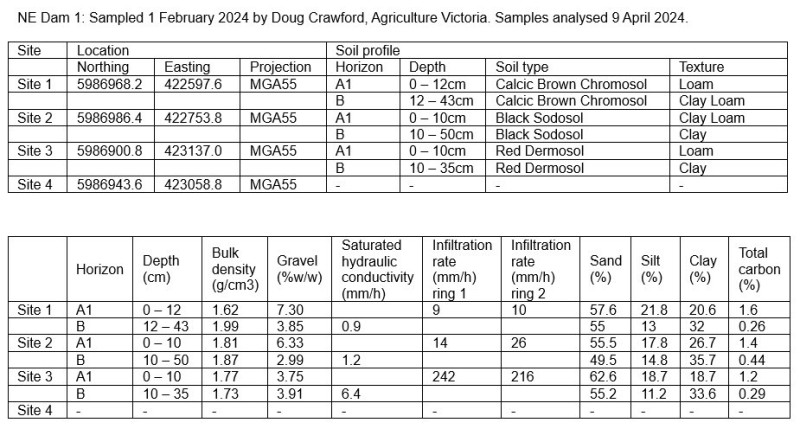
Monitoring
Spatial mapping
Layer stacking order (drag to reorder)
No active layer(s)
Address Search
 HERE
HERE
Measure
Measure distance between points or area of a polygon
Active Layer
Transparency
Toggle querying
Specify Filter Attributes
Export this layer
Current map extent (max 500 features)
Climate history
20 year monthly climate range
| Month | Rainfall range | Evaporation range | |||||||
|---|---|---|---|---|---|---|---|---|---|
| Decile 1 | Decile 3 | Decile 5 | Decile 7 | Decile 10 | Decile 7 | Decile 5 | Decile 3 | ||
| Drought | Dry | Average | Wet | Drought | Dry | Average | Wet | ||
| January | 3mm | 13.2mm | 40.8mm | 59.2mm | 306.8mm | 254.3mm | 214.6mm | 201.9mm | |
| February | 2.1mm | 14.1mm | 22.6mm | 33.2mm | 234.8mm | 193.4mm | 178.8mm | 170.7mm | |
| March | 6.5mm | 24.1mm | 34.5mm | 56.8mm | 178.3mm | 161.8mm | 156.4mm | 128.4mm | |
| April | 4.6mm | 15.3mm | 24.8mm | 37.3mm | 101.6mm | 84.9mm | 77.3mm | 69.6mm | |
| May | 22mm | 30.8mm | 34mm | 43.5mm | 61.7mm | 46.5mm | 44.3mm | 40.6mm | |
| June | 22.1mm | 31.9mm | 50mm | 64.4mm | 35.8mm | 31.1mm | 29.3mm | 26.9mm | |
| July | 23.5mm | 41.6mm | 58.3mm | 62.1mm | 40.8mm | 34mm | 33mm | 30.5mm | |
| August | 2.9mm | 28.9mm | 38.5mm | 52.1mm | 56.6mm | 51.1mm | 48.1mm | 45.8mm | |
| September | 6.8mm | 16.8mm | 22.8mm | 44mm | 101.9mm | 85.9mm | 80.1mm | 77.3mm | |
| October | 9.3mm | 23.9mm | 28.4mm | 46.4mm | 159.2mm | 140.4mm | 125.1mm | 108.2mm | |
| November | 8.7mm | 36.4mm | 51.7mm | 69.9mm | 192.6mm | 171.7mm | 163.1mm | 157.6mm | |
| December | 10.9mm | 24.6mm | 33.9mm | 49.5mm | 248.9mm | 215.5mm | 209.1mm | 191.9mm | |