North West (Bendigo) Dam 2 NW 2
Summary
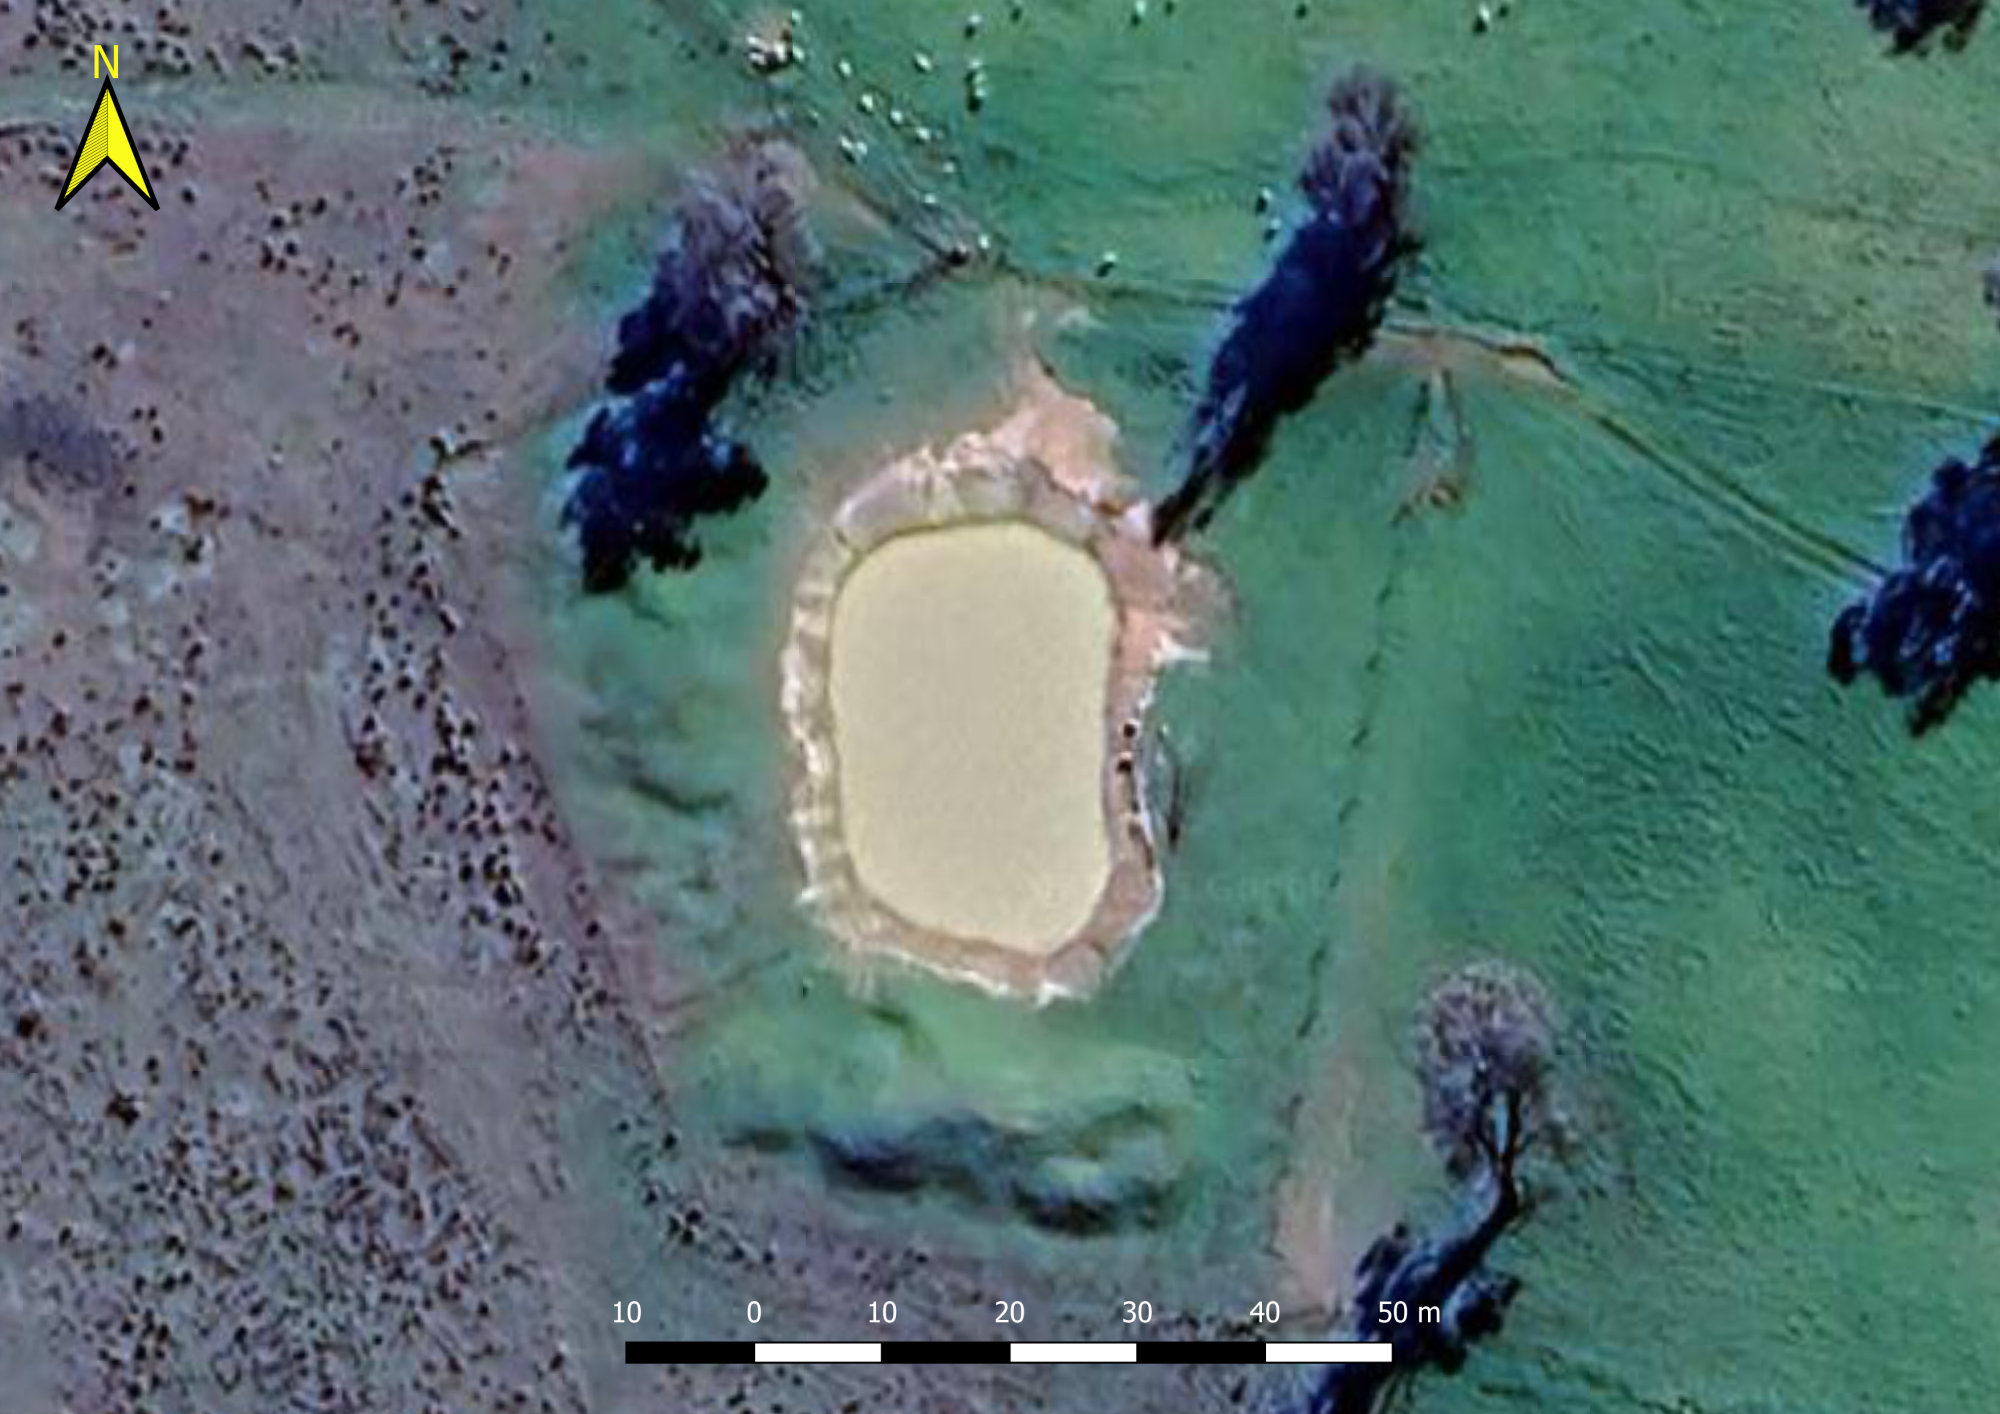
Location: Newbridge, Loddon Shire, North Central CMA
Primary Land use: Mixed farming; cropping and grazing
Australian Drainage Division: Murray-Darling (Division IV)
Australian River Basin: Loddon River (Basin 7)
Catchment Geology: Pliocene to Holocene colluvium (Qc1) (clay, silt, sand, gravel) near dam;
Ordovician Castlemaine Group (Ocl) sedimentary rocks (shale, sandstone, mudstone) north and east of the dam
Catchment Geomorphology:
2.0 Western Uplands (Tier 1);
2.1 Dissected Uplands (Tier 2);
2.1.2 Hills, valley slopes and plains on non- granitic Palaeozoic rocks (Tier 3)
Australian Soil Classification: Sodosol
Catchment Soils:
About
| Location | -36.77993,143.93618 |
|---|---|
| Shape Profile | Custom |
| Maximum depth when full | 2m |
| Current (or actual) water depth | 1m |
| Water level offset | 0.2m |
| Dam area | 1050m2 |
| Maximum volume | 1126m3 |
| Catchment area | 123930.00m2 |
Water balance
The water balance forecasts chart shows the predicted water level and volume for various climate scenarios from the starting water level.
Chart options
Maximum depth when full:Auto calculated variables
Dam area:20 year monthly climate range
| Month | Rainfall range | Evaporation range | |||||||
|---|---|---|---|---|---|---|---|---|---|
| Decile 1 | Decile 3 | Decile 5 | Decile 7 | Decile 10 | Decile 7 | Decile 5 | Decile 3 | ||
| Drought | Dry | Average | Wet | Drought | Dry | Average | Wet | ||
| January | 0mm | 8mm | 25.1mm | 33.6mm | 301.8mm | 254.7mm | 225.6mm | 210.7mm | |
| February | 1.7mm | 5.3mm | 16.1mm | 21.3mm | 225.8mm | 197.5mm | 185.7mm | 171.5mm | |
| March | 8mm | 17.7mm | 26.8mm | 38.3mm | 181.1mm | 163.2mm | 144.5mm | 128.2mm | |
| April | 5.7mm | 9.9mm | 21.1mm | 47.2mm | 104.3mm | 94.7mm | 82mm | 73.6mm | |
| May | 13.9mm | 19.2mm | 27.5mm | 34.9mm | 63.9mm | 53.2mm | 46.9mm | 44.3mm | |
| June | 11.3mm | 26mm | 41.6mm | 53.9mm | 40.1mm | 33.5mm | 31.3mm | 28.9mm | |
| July | 17.8mm | 35mm | 44.2mm | 48.3mm | 47.3mm | 37.9mm | 36.1mm | 32.3mm | |
| August | 7.3mm | 25.8mm | 35.4mm | 41.9mm | 66.1mm | 54.9mm | 52.1mm | 50.4mm | |
| September | 6mm | 13.9mm | 28.2mm | 37.7mm | 99.5mm | 88.7mm | 85mm | 83.1mm | |
| October | 2.1mm | 12.8mm | 26mm | 32.9mm | 173.6mm | 140.6mm | 126.8mm | 112.5mm | |
| November | 5.7mm | 30.4mm | 35.6mm | 54.3mm | 201.2mm | 174.4mm | 164.1mm | 154.4mm | |
| December | 5.1mm | 16.2mm | 22.5mm | 39.1mm | 275.4mm | 221.7mm | 205.8mm | 196.5mm | |
Monitoring
Spatial mapping
Layer stacking order (drag to reorder)
No active layer(s)
Address Search
 HERE
HERE
Measure
Measure distance between points or area of a polygon
Active Layer
Transparency
Toggle querying
Specify Filter Attributes
Export this layer
Current map extent (max 500 features)
Climate history
20 year monthly climate range
| Month | Rainfall range | Evaporation range | |||||||
|---|---|---|---|---|---|---|---|---|---|
| Decile 1 | Decile 3 | Decile 5 | Decile 7 | Decile 10 | Decile 7 | Decile 5 | Decile 3 | ||
| Drought | Dry | Average | Wet | Drought | Dry | Average | Wet | ||
| January | 0mm | 8mm | 25.1mm | 33.6mm | 301.8mm | 254.7mm | 225.6mm | 210.7mm | |
| February | 1.7mm | 5.3mm | 16.1mm | 21.3mm | 225.8mm | 197.5mm | 185.7mm | 171.5mm | |
| March | 8mm | 17.7mm | 26.8mm | 38.3mm | 181.1mm | 163.2mm | 144.5mm | 128.2mm | |
| April | 5.7mm | 9.9mm | 21.1mm | 47.2mm | 104.3mm | 94.7mm | 82mm | 73.6mm | |
| May | 13.9mm | 19.2mm | 27.5mm | 34.9mm | 63.9mm | 53.2mm | 46.9mm | 44.3mm | |
| June | 11.3mm | 26mm | 41.6mm | 53.9mm | 40.1mm | 33.5mm | 31.3mm | 28.9mm | |
| July | 17.8mm | 35mm | 44.2mm | 48.3mm | 47.3mm | 37.9mm | 36.1mm | 32.3mm | |
| August | 7.3mm | 25.8mm | 35.4mm | 41.9mm | 66.1mm | 54.9mm | 52.1mm | 50.4mm | |
| September | 6mm | 13.9mm | 28.2mm | 37.7mm | 99.5mm | 88.7mm | 85mm | 83.1mm | |
| October | 2.1mm | 12.8mm | 26mm | 32.9mm | 173.6mm | 140.6mm | 126.8mm | 112.5mm | |
| November | 5.7mm | 30.4mm | 35.6mm | 54.3mm | 201.2mm | 174.4mm | 164.1mm | 154.4mm | |
| December | 5.1mm | 16.2mm | 22.5mm | 39.1mm | 275.4mm | 221.7mm | 205.8mm | 196.5mm | |