South East (Gippsland) Dam 1 GIPP 1
Summary
Location: Tarwin Lower, South Gippsland Shire, West Gippsland CMA
Primary Land use: Mixed farming, grazing
Australian Drainage Division: Southeast Coast (Division II)
Australian River Basin: South Gippsland (Basin 27)
Catchment Geology: Early Devonian Liptrap Formation (Dxl) (sandstone, siltstone)
Catchment Geomorphology:
3.0 Southern Uplands (Tier 1);
3.3 Very low relief (very low elevation, generally less than 100 m) (Tier 2);
3.3.2 Hills and low hills (Tier 3)
Australian Soil Classification: Sodosol
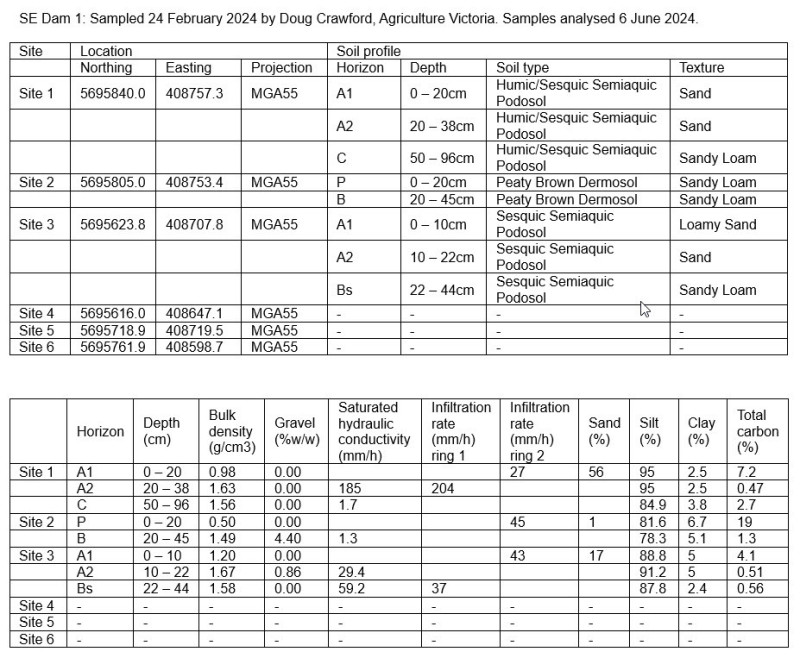
Catchment Soils:
About
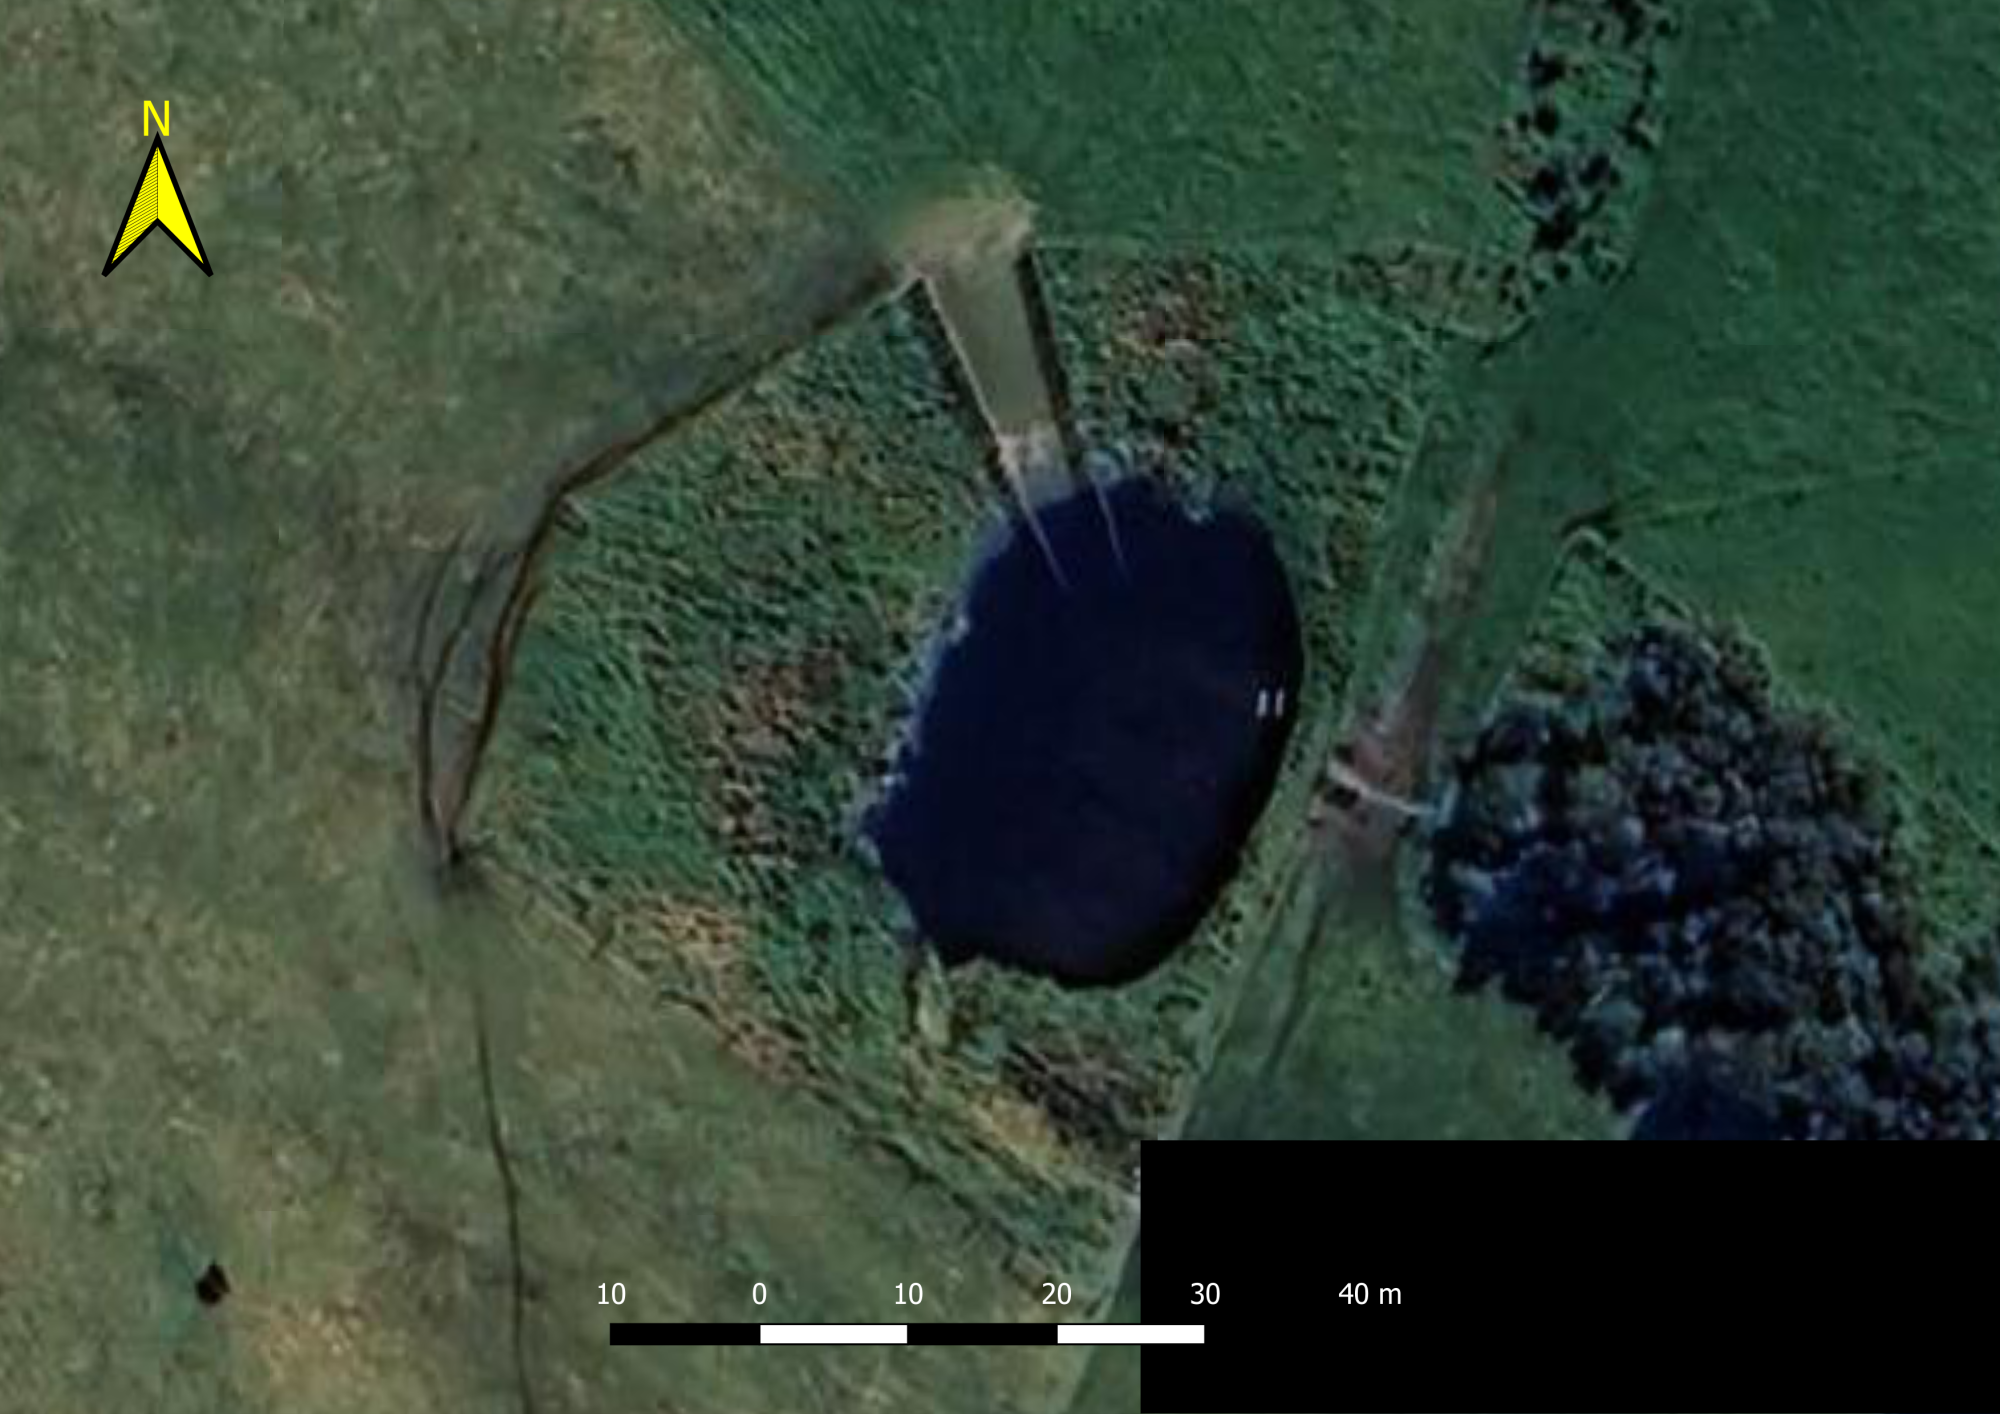
| Location | -38.88382,145.94853 |
|---|---|
| Shape Profile | Custom |
| Maximum depth when full | 2m |
| Current (or actual) water depth | 2m |
| Water level offset | 0.2m |
| Dam area | 909m2 |
| Maximum volume | 896m3 |
| Catchment area | 43000.00m2 |
Water balance
The water balance forecasts chart shows the predicted water level and volume for various climate scenarios from the starting water level.
Chart options
Maximum depth when full:Auto calculated variables
Dam area:20 year monthly climate range
| Month | Rainfall range | Evaporation range | |||||||
|---|---|---|---|---|---|---|---|---|---|
| Decile 1 | Decile 3 | Decile 5 | Decile 7 | Decile 10 | Decile 7 | Decile 5 | Decile 3 | ||
| Drought | Dry | Average | Wet | Drought | Dry | Average | Wet | ||
| January | 7.3mm | 22mm | 37.4mm | 53.6mm | 210.5mm | 188.5mm | 178.2mm | 170mm | |
| February | 3.5mm | 14.9mm | 42mm | 54.9mm | 182.7mm | 152mm | 144.6mm | 136.9mm | |
| March | 18.6mm | 46mm | 49.6mm | 57.3mm | 147mm | 132.6mm | 116.9mm | 111.2mm | |
| April | 35mm | 46.6mm | 67.9mm | 80.3mm | 89.7mm | 76mm | 70.5mm | 67.8mm | |
| May | 63.7mm | 76.3mm | 88.6mm | 111.2mm | 71.5mm | 52.2mm | 49.4mm | 43.7mm | |
| June | 42.9mm | 65.1mm | 83.2mm | 109.2mm | 41.5mm | 36.8mm | 35.5mm | 32.7mm | |
| July | 53.3mm | 60.7mm | 105.2mm | 118.3mm | 54.3mm | 46.1mm | 41.8mm | 37.3mm | |
| August | 50.5mm | 64.3mm | 89.2mm | 106.6mm | 76.6mm | 60.3mm | 55.2mm | 53mm | |
| September | 45.3mm | 58.2mm | 88.7mm | 101.7mm | 95.9mm | 84.2mm | 83.3mm | 79.8mm | |
| October | 7.5mm | 28.6mm | 64mm | 97.9mm | 156.3mm | 117.4mm | 107.7mm | 103.7mm | |
| November | 25.2mm | 35.3mm | 57.9mm | 73.9mm | 156.3mm | 131.7mm | 128mm | 124mm | |
| December | 21.9mm | 40.9mm | 54.7mm | 70.5mm | 201.3mm | 172.3mm | 160.1mm | 146.3mm | |
Monitoring
is a long established fact that a reader will be distracted by the readable content of a page when looking at its layout. The point of using Lorem Ipsum is that it has a more-or-less normal distribution of letters, as opposed to using 'Content here, content here', making it look like readable English. Many desktop publishing packages and web page editors now use Lorem Ipsum as their default model text, and a search for 'lorem ipsum' will uncover many web sites still in their infancy. Various versions have evolved over the years, sometimes by accident, sometimes on purpose (injected humour and the like).
Spatial mapping
Layer stacking order (drag to reorder)
No active layer(s)
Address Search
 HERE
HERE
Measure
Measure distance between points or area of a polygon
Active Layer
Transparency
Toggle querying
Specify Filter Attributes
Export this layer
Current map extent (max 500 features)
Climate history
20 year monthly climate range
| Month | Rainfall range | Evaporation range | |||||||
|---|---|---|---|---|---|---|---|---|---|
| Decile 1 | Decile 3 | Decile 5 | Decile 7 | Decile 10 | Decile 7 | Decile 5 | Decile 3 | ||
| Drought | Dry | Average | Wet | Drought | Dry | Average | Wet | ||
| January | 7.3mm | 22mm | 37.4mm | 53.6mm | 210.5mm | 188.5mm | 178.2mm | 170mm | |
| February | 3.5mm | 14.9mm | 42mm | 54.9mm | 182.7mm | 152mm | 144.6mm | 136.9mm | |
| March | 18.6mm | 46mm | 49.6mm | 57.3mm | 147mm | 132.6mm | 116.9mm | 111.2mm | |
| April | 35mm | 46.6mm | 67.9mm | 80.3mm | 89.7mm | 76mm | 70.5mm | 67.8mm | |
| May | 63.7mm | 76.3mm | 88.6mm | 111.2mm | 71.5mm | 52.2mm | 49.4mm | 43.7mm | |
| June | 42.9mm | 65.1mm | 83.2mm | 109.2mm | 41.5mm | 36.8mm | 35.5mm | 32.7mm | |
| July | 53.3mm | 60.7mm | 105.2mm | 118.3mm | 54.3mm | 46.1mm | 41.8mm | 37.3mm | |
| August | 50.5mm | 64.3mm | 89.2mm | 106.6mm | 76.6mm | 60.3mm | 55.2mm | 53mm | |
| September | 45.3mm | 58.2mm | 88.7mm | 101.7mm | 95.9mm | 84.2mm | 83.3mm | 79.8mm | |
| October | 7.5mm | 28.6mm | 64mm | 97.9mm | 156.3mm | 117.4mm | 107.7mm | 103.7mm | |
| November | 25.2mm | 35.3mm | 57.9mm | 73.9mm | 156.3mm | 131.7mm | 128mm | 124mm | |
| December | 21.9mm | 40.9mm | 54.7mm | 70.5mm | 201.3mm | 172.3mm | 160.1mm | 146.3mm | |