South West (Corangamite) Dam 3 SW 3
Summary
Location: Rokewood, Golden Plains Shire, Corangamite CMA
Primary Land use: Mixed farming, cropping and grazing
Australian Drainage Division: Southeast Coast (Division II)
Australian River Basin: Lake Corangamite (Basin 34)
Catchment Geology:
Miocene to Holocene Newer Volcanic Group: basalt flows (Neo), stony rises basalt (Neo2);
Pleistocene to Holocene alluvium: generic (Qa1)
Catchment Geomorphology:
6.0 Western Plains (Tier 1);
6.1 Volcanic Plains (Tier 2);
6.1.3 Plains with poorly developed drainage and shallow regolith (Tier 3)
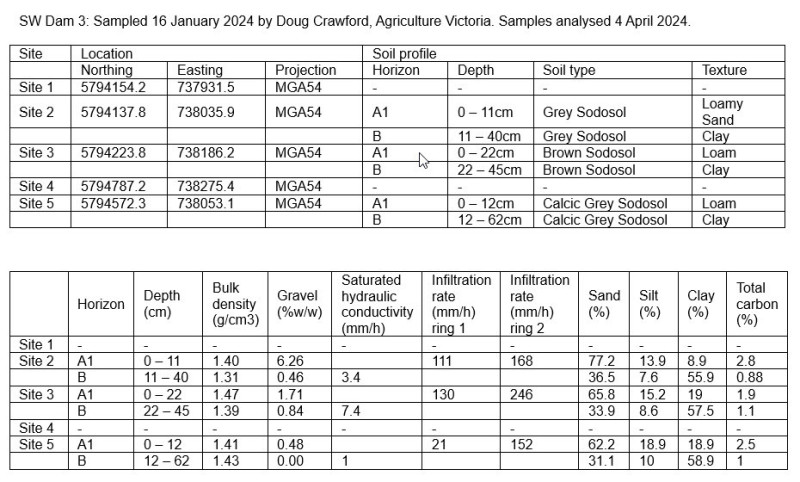
Australian Soil Classification: Sodosol
Catchment Soils:
About
| Location | -37.96905,143.70809 |
|---|---|
| Shape Profile | Custom |
| Maximum depth when full | 3m |
| Current (or actual) water depth | 1m |
| Water level offset | 0.2m |
| Dam area | 410m2 |
| Maximum volume | 479m3 |
| Catchment area | 791520.00m2 |
Water balance
The water balance forecasts chart shows the predicted water level and volume for various climate scenarios from the starting water level.
Chart options
Maximum depth when full:Auto calculated variables
Dam area:20 year monthly climate range
| Month | Rainfall range | Evaporation range | |||||||
|---|---|---|---|---|---|---|---|---|---|
| Decile 1 | Decile 3 | Decile 5 | Decile 7 | Decile 10 | Decile 7 | Decile 5 | Decile 3 | ||
| Drought | Dry | Average | Wet | Drought | Dry | Average | Wet | ||
| January | 1.4mm | 17.8mm | 21.8mm | 46.5mm | 251mm | 214.8mm | 205.6mm | 185.4mm | |
| February | 0.8mm | 6.9mm | 23.8mm | 26.6mm | 186.5mm | 170.8mm | 162.5mm | 157.4mm | |
| March | 16.5mm | 23.1mm | 31.1mm | 41.4mm | 171.4mm | 148.7mm | 129.2mm | 121.7mm | |
| April | 13.4mm | 27.4mm | 32.3mm | 48.5mm | 96.7mm | 87.3mm | 78mm | 72.1mm | |
| May | 9.2mm | 33.6mm | 41.4mm | 50.1mm | 71.8mm | 55.6mm | 50mm | 44.3mm | |
| June | 22.8mm | 32.3mm | 46.9mm | 68.9mm | 42.5mm | 36.2mm | 33.8mm | 32mm | |
| July | 22.2mm | 37.3mm | 45.2mm | 54mm | 51.5mm | 42.8mm | 39.7mm | 37.3mm | |
| August | 16.7mm | 31.2mm | 47.5mm | 55.6mm | 73.2mm | 57.4mm | 54.4mm | 52.1mm | |
| September | 21.2mm | 35.9mm | 39.9mm | 55.6mm | 100.3mm | 88.8mm | 86.9mm | 78.3mm | |
| October | 5.8mm | 30.7mm | 37.7mm | 68.1mm | 163.4mm | 129.2mm | 118.9mm | 110.1mm | |
| November | 18.4mm | 40.2mm | 47.9mm | 62.5mm | 172.1mm | 155mm | 145.7mm | 130.9mm | |
| December | 6.3mm | 25.5mm | 30.4mm | 41.5mm | 235.7mm | 190mm | 177.8mm | 171.1mm | |
Monitoring
Spatial mapping
Layer stacking order (drag to reorder)
No active layer(s)
Address Search
 HERE
HERE
Measure
Measure distance between points or area of a polygon
Active Layer
Transparency
Toggle querying
Specify Filter Attributes
Export this layer
Current map extent (max 500 features)
Climate history
20 year monthly climate range
| Month | Rainfall range | Evaporation range | |||||||
|---|---|---|---|---|---|---|---|---|---|
| Decile 1 | Decile 3 | Decile 5 | Decile 7 | Decile 10 | Decile 7 | Decile 5 | Decile 3 | ||
| Drought | Dry | Average | Wet | Drought | Dry | Average | Wet | ||
| January | 1.4mm | 17.8mm | 21.8mm | 46.5mm | 251mm | 214.8mm | 205.6mm | 185.4mm | |
| February | 0.8mm | 6.9mm | 23.8mm | 26.6mm | 186.5mm | 170.8mm | 162.5mm | 157.4mm | |
| March | 16.5mm | 23.1mm | 31.1mm | 41.4mm | 171.4mm | 148.7mm | 129.2mm | 121.7mm | |
| April | 13.4mm | 27.4mm | 32.3mm | 48.5mm | 96.7mm | 87.3mm | 78mm | 72.1mm | |
| May | 9.2mm | 33.6mm | 41.4mm | 50.1mm | 71.8mm | 55.6mm | 50mm | 44.3mm | |
| June | 22.8mm | 32.3mm | 46.9mm | 68.9mm | 42.5mm | 36.2mm | 33.8mm | 32mm | |
| July | 22.2mm | 37.3mm | 45.2mm | 54mm | 51.5mm | 42.8mm | 39.7mm | 37.3mm | |
| August | 16.7mm | 31.2mm | 47.5mm | 55.6mm | 73.2mm | 57.4mm | 54.4mm | 52.1mm | |
| September | 21.2mm | 35.9mm | 39.9mm | 55.6mm | 100.3mm | 88.8mm | 86.9mm | 78.3mm | |
| October | 5.8mm | 30.7mm | 37.7mm | 68.1mm | 163.4mm | 129.2mm | 118.9mm | 110.1mm | |
| November | 18.4mm | 40.2mm | 47.9mm | 62.5mm | 172.1mm | 155mm | 145.7mm | 130.9mm | |
| December | 6.3mm | 25.5mm | 30.4mm | 41.5mm | 235.7mm | 190mm | 177.8mm | 171.1mm | |